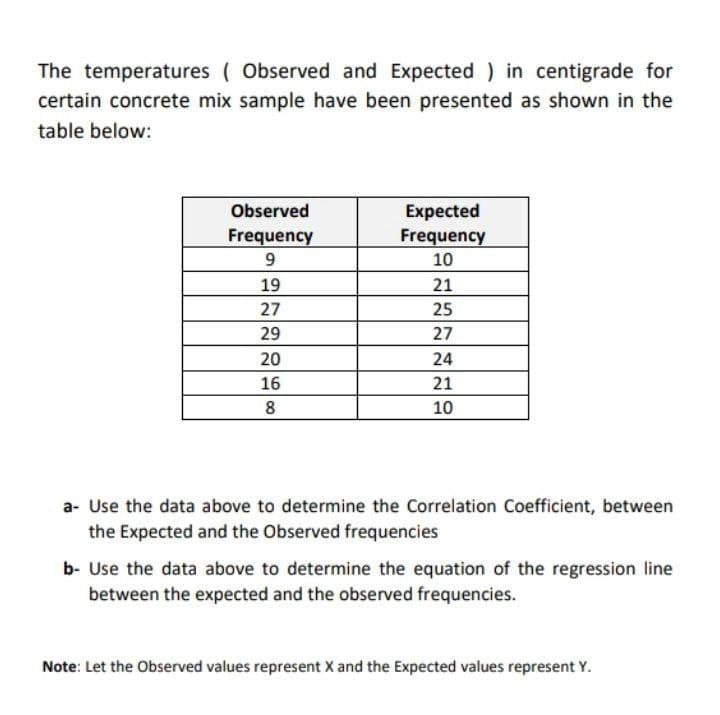
The temperatures (Observed and Expected) in centigrade for certain concrete mix sample have been presented as shown in the table below: Observed Expected Frequency Frequency 9 10 19 21 27 25 29 27 20 24 16 21 8 10 a- Use the data above to determine the Correlation Coefficient, between the Expected and the Observed frequencies b- Use the data above to determine the equation of the regression line between the expected and the observed frequencies. Note: Let the Observed values represent X and the Expected values represent Y.
Q: Use the ALEKS calculator to solve the following problems. (a) Consider a t distribution with 13…
A: We need to find the required probabilities using a t distribution.
Q: Estimating a ratio Independent normal random variables X and Y have means μ and pu respectively, and…
A: Given that X and Y are independent normal random variables with means μ and ρμ respectively and both…
Q: Class Interval 96 - 100 91 - 95 86 - 90 81-85 76 - 80 71-75 66-70 Lower Boundaries (LB) 95.5 90.5…
A: The data is as follows Class Interval Lower Boundaries Frequency Less than cumulative frequency…
Q: A study was done to look at the relationship between number of movies people watch at the theater…
A: Given n=10
Q: b. Rice Bodi (25) Sugar (90) Bodi (25) Egg Plant (75) = Rice The pie chart above shows the allotment…
A: The question is based on a pie chart Given : From pie chart,
Q: What is the probability that a randomly selected person from the population tests positive?
A: Let us define some events A : a person has cooties. B : a person does not have cooties. E : a person…
Q: Assume that a sample is used to estimate a population proportion p. Find the 99.9% confidence…
A:
Q: Section H: Hyla chrysoscelis is a type of gray tree frog with a distinct mating call. Frogs are…
A: Solution The analysis is the regression analysis .
Q: A programmer plans to develop a new software system. In planning for the operating system that he…
A: It is given that margin of error (E) is 0.03 and the confidence level is 0.95.
Q: A jar contains 10 red marbles numbered 1 to 10 and 8 blue marbles numbered 1 to 8. A marble is drawn…
A: GivenA jar contains No.of red marbles numbered 1-10=10No.of blue marbles numbered 1-8=8Total no.of…
Q: A Dag of Mams has 2 red, 3 green, 6 blue, and yellow Mams. What is the probability (Round to 4…
A:
Q: A builder claims that heat pumps are installed in 70% of all homes being constructed today in the…
A: The null hypothesis is: H0: The true proportion of heat pumps installed in the city of Masaya is…
Q: For a standard normal distribution, find: P(z > -0.85)
A: Here: For a standard normal distribution, we have to find:P(z > -0.85)
Q: Directions: Study the table below. Find the critical value, draw the rejection region, compute the…
A: A)GivenH0:μ=14Ha:μ≠14x=11.5s=5.5n=35α=0.01
Q: Suppose X₁,..., Xn are independent exp(X) random variables, where is the rate parameter. Find UMVUE…
A: Let X1, ......Xn are the independent exp(λ) random variables,where λ is the rate parameter.X¯ is a…
Q: yllabus odules nnouncements Scussions ades: ogle Drive ice 365 opto Recordings m Question 2 < You…
A:
Q: Giving a test to a group of students, the grades and gender are summarized below Grades and Gender A…
A:
Q: are summarized below A B C Total Male 8 15 18 41 Female 11 12 17 40 Total 19 27 35 81 Let p…
A: Given Sample size =40 Sample success=12
Q: regression coefficients differ in multiple regression and simple linear regression?
A: *Answer:
Q: The distribution of average hours of sleep per weeknight among college students is found to be…
A:
Q: From the letters {A, B, C, D, E, F. G}, how :many 3-distinct-letters codes can be (a) generated? (b)…
A: a) 7C3 distinct codes can be generated by {A,B,C,D,E,F,G} which is equal to 21
Q: Giving a test to a group of students, the grades and gender are summarized below. Round your answers…
A: From the above table, if a student is chosen at random then a) The probability that the student got…
Q: Suppose that a researcher is interested in estimating the mean systolic blood pressure, μ, of…
A:
Q: For a standard normal distribution, find: P(z < -2.98)
A: Here: For a standard normal distributionwe have to find P(z < -2.98)
Q: An IQ test is designed so that the mean is 100 and the standard deviation is 18 for the population…
A: Given information- Population mean, µ = 100 Population standard deviation, σ = 18 Error = 4…
Q: 55% of all Americans live in cities with population greater than 100,000 people. If 31 Americans are…
A: It is given that n = 31 and p = 0.55.
Q: Assume that a sample is used to estimate a population proportion p. Find the 99% confidence interval…
A:
Q: A special deck of cards has 10 green cards, 12 blue cards, and 6 red cards. When a card is picked,…
A: Given data A special deck of cards has 10 green cards 12 blue cards and 6 red cards.
Q: The Laurier Company's brand has a market share of 30%. Suppose that 1,000 consumers of the product…
A:
Q: (3 Random sultanas in scones (a) Show that for a Poisson distribution the mean is equal to the…
A:
Q: A company reports that the number of breakdowns on its assembly line follows Poisson distribution…
A: Solution-: Given : λ=1 We want to find (a) P(exactly one break down during 5 hours shift)=? (b)…
Q: Page 456 1. Specifications for a part for a 3-D printer state that the part should weigh between 24…
A:
Q: Acme Corporation manufactures light bulbs. The CEO claims that an average Acme light bulb lasts 300…
A: Solution-: Given: n=15, \bar{x}=290, s=50 Claim: μ<300 We want to find, P(15 randomly selected…
Q: The probability of an event depends on the random variable X and can be expressed by the following…
A:
Q: Suppose customers in a hardware store are willing to buy N(p) boxes of nails at p dollars per box,…
A:
Q: For a standard normal distribution, find: P(z > c) = 0.1084 Find c.
A:
Q: If one of the pedestrian deaths is randomly selected, find the probability that the pedestrian was…
A:
Q: Eight schoolchildren, chosen at random from the first year of a large school, were given, without…
A:
Q: II. Do what is indicated in order to answer the following problems, use only blue or black pen. Do…
A: As per the Bartleby guildlines we have to solve first three subparts and rest can be reposted....…
Q: Section D: A research team believes that the systolic blood pressure of adult males is normally…
A: Given information Sample mean x̅ = 130 Population mean µ = 135 Sample size n = 36 Population…
Q: 1.35 0.38 0.52
A:
Q: Use the spinner below to find the probability of getting the following after 1 spin. 12 1 11 2…
A:
Q: ationships between variables? involved in a data collection. extraneous variables. Final nds, what…
A: *Answer: Bar charts are useful in comparing categories of a variable or two categorical…
Q: The number of ants on a flower head is a random variable having the following distribution. 0 2…
A:
Q: Assume that random guesses are made for seven multiple choice questions on an SAT test, so that…
A: Obtain the probability that the number X of correct answers is fewer than 4. The probability that…
Q: You want to obtain a sample to estimate a population proportion. Based on previous evidence, you…
A:
Q: USE MULTINOMIAL DISTRIBUTION METHOD The surface of a circular dart board has a small center circle…
A: The following information has been given: The total number of throws are n=7. pbull's eye=0.01…
Q: Find the DECILE and PERCENTILE of this grouped data. *Include Step by Step process and Interpretion…
A: The objective is to determine the decile and percentile of this grouped data.
Q: Zaire buys a bag of cookies that contains 7 chocolate chip cookies, 5 peanut butter cookies, 9 sugar…
A: It is given that the Zaire buys a bag of cookies that contains 7 chocolate chip cookies, 5 peanut…
Q: A hacker is trying to guess someone's password. The hacker knows (somehow) that the password is 5…
A: Please see below
Step by step
Solved in 2 steps with 2 images
- Olympic Pole Vault The graph in Figure 7 indicates that in recent years the winning Olympic men’s pole vault height has fallen below the value predicted by the regression line in Example 2. This might have occurred because when the pole vault was a new event there was much room for improvement in vaulters’ performances, whereas now even the best training can produce only incremental advances. Let’s see whether concentrating on more recent results gives a better predictor of future records. (a) Use the data in Table 2 (page 176) to complete the table of winning pole vault heights shown in the margin. (Note that we are using x=0 to correspond to the year 1972, where this restricted data set begins.) (b) Find the regression line for the data in part ‚(a). (c) Plot the data and the regression line on the same axes. Does the regression line seem to provide a good model for the data? (d) What does the regression line predict as the winning pole vault height for the 2012 Olympics? Compare this predicted value to the actual 2012 winning height of 5.97 m, as described on page 177. Has this new regression line provided a better prediction than the line in Example 2?4. For a sample of 12 observations, a businessman wants to regress the price (in dollar) of the laptop (Y) on the processor's speed (X). The summary results of the observations are given below. Σx = 19.8 , Σy = 24798, Σxy = 431882 Σx^2 = 3388, Σγ^2 = 57365692 a) compute correlation coefficient (b) Find the fitted regression line of the price of laptop on processor speed.The accompanying data resulted from an experiment in which weld diameter and shear strength (in pounds) were determined for five different spot welds on steel. Below are the data collected and the regression equation. Diameter Strength 200.1 813.7 210.1 785.3 220.1 960.4 230.1 1118.0 240.0 1076.2 Strength = -941.6992 + 8.5988*Diameter The predicted y-hat value for a diameter of 201 is 864. if we observed a weld that had a diameter of 235 that had a strength 1000, what would be its residual?
- The following table gives the data for the average temperature and the snow accumulation in several small towns for a single month. Determine the equation of the regression line, yˆ=b0+b1x�^=�0+�1�. Round the slope and y-intercept to the nearest thousandth. Then determine if the regression equation is appropriate for making predictions at the 0.050.05 level of significance. Critical Values of the Pearson Correlation Coefficient Average Temperatures and Snow Accumulations Average Temperature (℉℉) 3939 2525 1515 4242 4242 2424 3232 2020 3030 3737 Snow Accumulation (in.in.) 66 1515 2929 66 1414 2626 2323 1212 1616 77 Copy Data Regression equation: yˆ=�^= Is the equation appropriate? YesThe following table gives the data for the average temperature and the snow accumulation in several small towns for a single month. Determine the equation of the regression line, yˆ=b0+b1xy^=b0+b1x. Round the slope and y-intercept to the nearest thousandth. Then determine if the regression equation is appropriate for making predictions at the 0.01 level of significance. Critical Values of the Pearson Correlation Coefficient Average Temperatures and Snow Accumulations Average Temperature (℉℉) 42 27 22 39 44 21 27 18 32 36 Snow Accumulation (in.in.) 6 11 22 8 12 27 27 20 12 6 Regression equation y=_______________ Is the equation appropriate?A study of the amount of rainfall and the quantity of air pollution removed produced the following data shown in table below: Daily Rainfall x (0.01 cm) Particulate Removed y (μg/m3) 7 126 7.9 129.3 7.5 125.3 9.2 120.2 10.8 116.7 5.8 119.2 5.6 138.7 2.7 147.5 9.2 110.3 Compute and interpret the coefficient of determination, and coefficient of correlation for the given data. What will be the regression equation, when swapped depended and independent variable
- The following table gives the data for the average temperature and the snow accumulation in several small towns for a single month. Determine the equation of the regression line, yˆ=b0+b1x. Round the slope and y-intercept to the nearest thousandth. Then determine if the regression equation is appropriate for making predictions at the 0.01 level of significance. Critical Values of the Pearson Correlation Coefficient Average Temperatures and Snow Accumulations Average Temperature (℉) 42 27 22 39 44 21 27 18 32 36 Snow Accumulation (in.) 6 11 22 8 12 27 27 20 12 6The following table gives the data for the average temperature and the snow accumulation in several small towns for a single month. Determine the equation of the regression line, yˆ=b0+b1xy^=b0+b1x. Round the slope and y-intercept to the nearest thousandth. Then determine if the regression equation is appropriate for making predictions at the 0.01 level of significance. Critical Values of the Pearson Correlation Coefficient Average Temperatures and Snow Accumulations Average Temperature (℉℉) 45 31 16 35 35 22 26 23 25 39 Snow Accumulation (in.in.) 9 20 23 6 10 29 22 14 12 9 Question 1: Regression equation y=__________ Question 2: Is the equation appropriate? Yes or No?4.For a sample of 12 observations, a businessman wants to regress the price (in dollar) of the laptop (Y) on the processor's speed (X). The summary results of the observations are given below. Σx = 19.8 , Σy = 24798, Σxy = 431882 Σx^2 = 33.88, Σγ^2 = 57365692 (b)Find the fitted regression line of the price of laptop on processor speed. (c) Find the predicted price of the laptop (y) for the processor speed x-1.9. (d) Compute the coefficient of determination and comment.
- The following is a partial computer output of a multiple regression analysis of a data set containing 20 sets of observations on the dependent variableThe regression equation isSALEPRIC = 1470 + 0.814 LANDVAL + 0.820 IMPROVAL + 13.5 AREA Predictor Coef SE Coef T P Constant 1470 5746 0.26 0.801 LANDVAL 0.8145 0.5122 1.59 0.131 IMPROVAL 0.8204 0.2112 3.88 0.0001 AREA 13.529 6.586 2.05 0.057 S = 79190.48 R-Sq = 89.7% R-Sq(adj) = 87.8% Analysis of Variance Source DF SS MS Regression 3 8779676741 2926558914 Residual Error 16 1003491259 62718204 Total 19 9783168000 For the problem above, we want to carry out the significance test about the coefficient of LANDVAL, what is the t-value for this test, and is it significant? 46.66, significant 2.05, significant 1.59, not significant 0.26, not significantInterpret the estimated regression coefficient corresponding to the Z variable. Data Salary Education Experience Sex 29.7985 15 3 1 21.8219 4 0 0 22.8978 4 0 0 22.0917 1 1 0 21.8993 5 0 0 22.4829 3 1 1 28.0772 15 0 0 y=salary 23.6292 6 1 1 x1=education level in schooling years 32.3595 0 15 1 x2=experience level in employment level 21.794 1 0 0 d=sex (1 for male,0 for female) 19.8762 3 0 0 Ln(Y) = alpha +beta1X1 +Beta2X2+ Beta3D +Beta4Z +e 21.0253 3 0 0 where z =X2D 24.6323 0 5 1 19.0247 0 0 0 18.8857 0 0 0 21.8552 1 0 0 24.2675 6 1 0 18.7931 0 0 0 18.9276 0 0 0 23.4441 5 1 1 20.8047 2 0 0 18.26 0 0 0 20.6726 0 2 1 21.7815 3 0 0…A sample of 40 individuals collects their shoe size and the height (cm) for CSI data. The scatter plot and results from a simple linear regression are recorded: HEIGHT = 126.76238 + 4.8782178 SHOE SIZE Sample size: 40R (correlation coefficient) = 0.77918855P-value < 0.0001 (a) Does the scatterplot and results show a linear correlation between shoe size and height? (b) How can you tell? (c) Will it be appropriate to use the linear regression equation given in the output? (d) Krusty the Clown wears size 8.5 shoes. According to the linear regression equation, how tall is Krusty the Clown? (e) Sideshow Bob wears size 14 shoes. According to the linear regression equation, how tall is Sideshow Bob?