The test is done with a 95% confidence level. Find the test statistic, and p-value. (Round your test statistic and p-value to three decimal places). test statistic p-value
The test is done with a 95% confidence level. Find the test statistic, and p-value. (Round your test statistic and p-value to three decimal places). test statistic p-value

Algebra & Trigonometry with Analytic Geometry
13th Edition
ISBN:9781133382119
Author:Swokowski
Publisher:Swokowski
Chapter10: Sequences, Series, And Probability
Section10.8: Probability
Problem 10E

Related questions
Question
Please only answer PART B
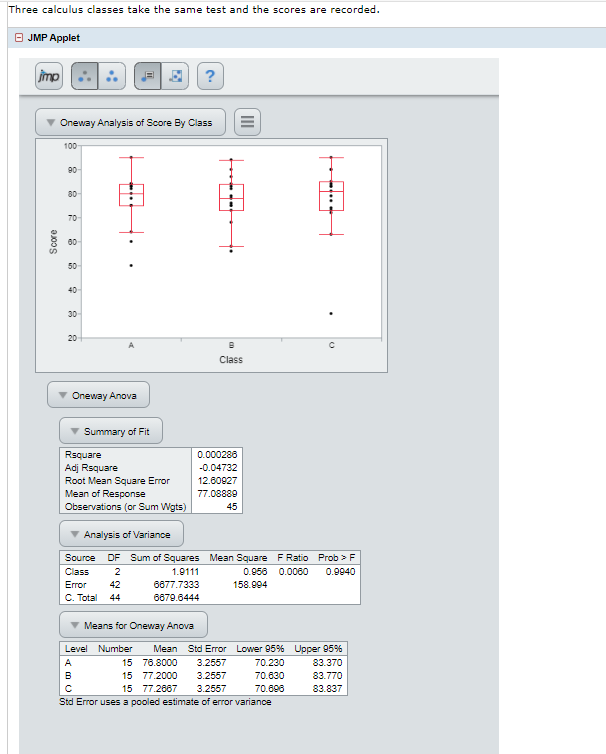
Transcribed Image Text:Three calculus classes take the same test and the scores are recorded.
O JMP Applet
imp
?
Oneway Analysis of Score By Class
100
90
80-
70
0-
50
40
30
20
Class
Oneway Anova
Summary of Fit
Rsquare
0.000280
Adj Rsquare
Root Mean Square Error
Mean of Response
-0.04732
12.60027
77.08889
Observations (or Sum Wgts)
45
Analysis of Variance
Source
DF Sum of Squares Mean Square FRatio Prob > F
Class
2
1.9111
0.956 0.0060
0.9940
Error
42
6677.7333
158.994
C. Total
44
6679.6444
Means for Oneway Anova
Level Number
Mean Std Error Lower 95% Upper 95%
A
15 76.8000
3.2557
70.230
83.370
15 77.2000
3.2557
70.630
83.770
15 77.2667
3.2557
70.606
83.837
Std Error uses a pooled estimate of error variance
II
::
Score
Transcribed Image Text:O (a)
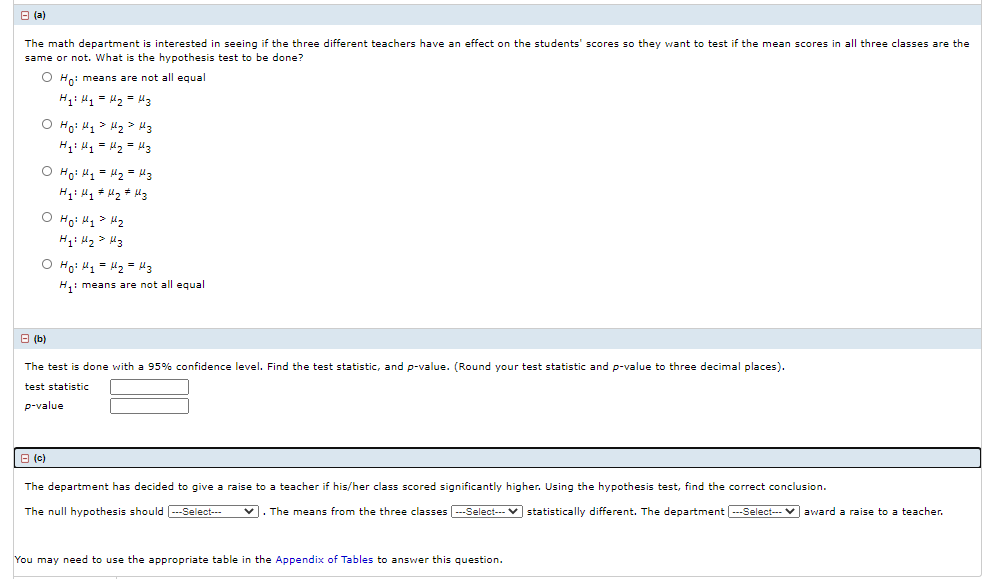
The math department is interested in seeing if the three different teachers have an effect on the students' scores so they want to test if the mean scores in all three classes are the
same or not. What is the hypothesis test to be done?
O Ho: means are not all equal
H: 41 = 2 = H3
O Ho: 41 > H2 > Mz
H: H = H2 = H3
O Ho: H1 = H2 = Mz
O Ho: Hq> Hz
O Hoi H1 = 42 = M3
H1 means are not all equal
B (b)
The test is done with a 95% confidence level. Find the test statistic, and p-value. (Round your test statistic and p-value to three decimal places).
test statistic
p-value
O (c)
The department has decided to give a raise to a teacher if his/her class scored significantly higher. Using the hypothesis test, find the correct conclusion.
The null hypothesis should --Select--
v. The means from the three classes -Select--- v statistically different. The department ---Select-- v award a raise to a teacher.
You may need to use the appropriate table in the Appendix of Tables to answer this question.
Expert Solution
This question has been solved!
Explore an expertly crafted, step-by-step solution for a thorough understanding of key concepts.

This is a popular solution!

Trending now
This is a popular solution!

Step by step
Solved in 2 steps with 1 images

Knowledge Booster


Learn more about
Need a deep-dive on the concept behind this application? Look no further. Learn more about this topic, statistics and related others by exploring similar questions and additional content below.Recommended textbooks for you
Algebra & Trigonometry with Analytic Geometry
Algebra
ISBN:
9781133382119
Author:
Swokowski
Publisher:
Cengage
Algebra & Trigonometry with Analytic Geometry
Algebra
ISBN:
9781133382119
Author:
Swokowski
Publisher:
Cengage