The test scores of 32 students are listed below. Construct a boxplot for the data set. 32 37 41 44 46 48 53 55 57 57 59 63 65 66 68 69 70 71 74 74 75 77 78 79 81 82 83 86 89 92 95 99 32 56 69.5 80 95 32 56 69.5 79 99 32 56 69.5 99 08 32 56 69.5 80 99
The test scores of 32 students are listed below. Construct a boxplot for the data set. 32 37 41 44 46 48 53 55 57 57 59 63 65 66 68 69 70 71 74 74 75 77 78 79 81 82 83 86 89 92 95 99 32 56 69.5 80 95 32 56 69.5 79 99 32 56 69.5 99 08 32 56 69.5 80 99

Glencoe Algebra 1, Student Edition, 9780079039897, 0079039898, 2018
18th Edition
ISBN:9780079039897
Author:Carter
Publisher:Carter
Chapter10: Statistics
Section10.3: Measures Of Spread
Problem 25PFA

Related questions
Topic Video
Question
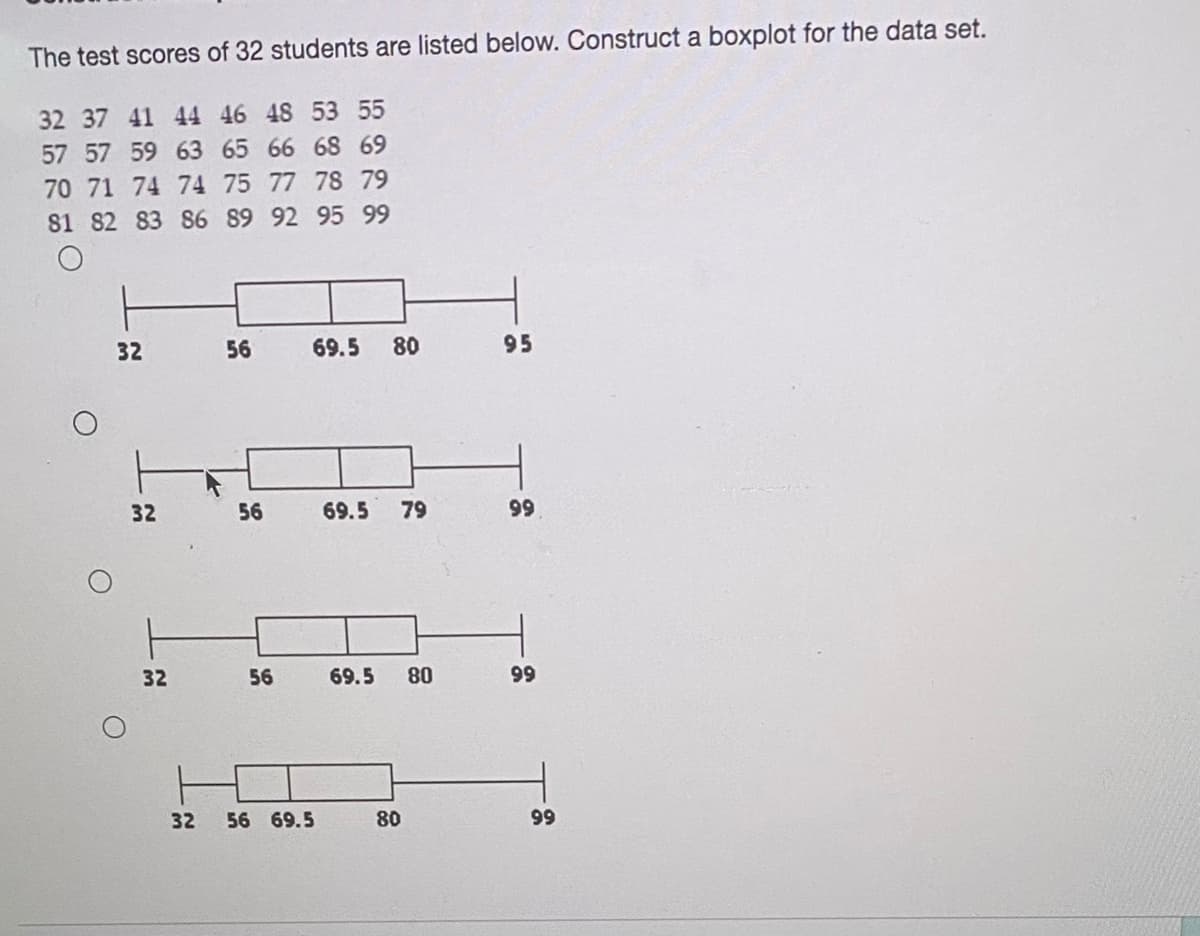
Transcribed Image Text:The test scores of 32 students are listed below. Construct a boxplot for the data set.
32 37 41 44 46 48 53 55
57 57 59 63 65 66 68 69
70 71 74 74 75 77 78 79
81 82 83 86 89 92 95 99
32
56
69.5
80
95
32
56
69.5
79
99
32
56
69.5
80
99
32
56 69.5
80
99
Expert Solution
Step 1


Trending now
This is a popular solution!

Step by step
Solved in 2 steps with 2 images

Knowledge Booster


Learn more about
Need a deep-dive on the concept behind this application? Look no further. Learn more about this topic, statistics and related others by exploring similar questions and additional content below.Recommended textbooks for you
Glencoe Algebra 1, Student Edition, 9780079039897…
Algebra
ISBN:
9780079039897
Author:
Carter
Publisher:
McGraw Hill
Glencoe Algebra 1, Student Edition, 9780079039897…
Algebra
ISBN:
9780079039897
Author:
Carter
Publisher:
McGraw Hill