The testing times for a group of college students were normally distributed with a mean of μ = 33 minutes and a standard deviation of a 2 minutes. The bell curve below represents the distribution for testing times. The scale on the horizontal axis is equal to the standard deviation. Fill in the indicated boxes. μ-30 μ-20 μ-0 μ H+O Used the Empirical Rule to complete the following statements: 95% of testing times were between μ = 33 σ = 2 68% of testing times were between 31 o minutes and 99.7% of testing times were between μ+2σ μ+30 50% of testing times were below minutes and minutes and minutes. minutes. minutes. minutes.
The testing times for a group of college students were normally distributed with a mean of μ = 33 minutes and a standard deviation of a 2 minutes. The bell curve below represents the distribution for testing times. The scale on the horizontal axis is equal to the standard deviation. Fill in the indicated boxes. μ-30 μ-20 μ-0 μ H+O Used the Empirical Rule to complete the following statements: 95% of testing times were between μ = 33 σ = 2 68% of testing times were between 31 o minutes and 99.7% of testing times were between μ+2σ μ+30 50% of testing times were below minutes and minutes and minutes. minutes. minutes. minutes.

Glencoe Algebra 1, Student Edition, 9780079039897, 0079039898, 2018
18th Edition
ISBN:9780079039897
Author:Carter
Publisher:Carter
Chapter10: Statistics
Section10.4: Distributions Of Data
Problem 19PFA

Related questions
Question
100%
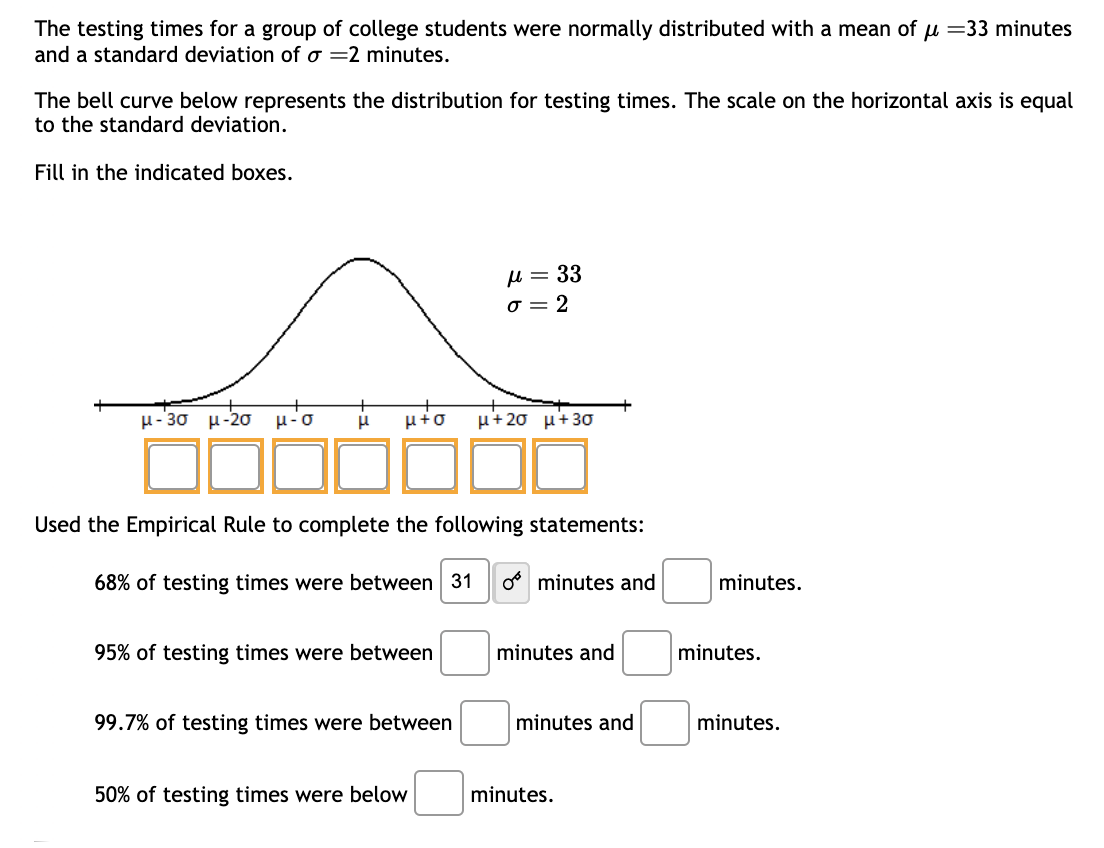
Transcribed Image Text:The testing times for a group of college students were normally distributed with a mean of μ = 33 minutes
and a standard deviation of o 2 minutes.
The bell curve below represents the distribution for testing times. The scale on the horizontal axis is equal
to the standard deviation.
Fill in the indicated boxes.
μ-30 μ-20 μ-
μ-o μ μ+o μ+20 μ+30
Used the Empirical Rule to complete the following statements:
68% of testing times were between 31 o minutes and
95% of testing times were between
μ = 33
σ=2
99.7% of testing times were between
50% of testing times were below
minutes and
minutes and
minutes.
minutes.
minutes.
minutes.
Expert Solution
This question has been solved!
Explore an expertly crafted, step-by-step solution for a thorough understanding of key concepts.

This is a popular solution!

Trending now
This is a popular solution!

Step by step
Solved in 2 steps with 1 images

Recommended textbooks for you
Glencoe Algebra 1, Student Edition, 9780079039897…
Algebra
ISBN:
9780079039897
Author:
Carter
Publisher:
McGraw Hill
Glencoe Algebra 1, Student Edition, 9780079039897…
Algebra
ISBN:
9780079039897
Author:
Carter
Publisher:
McGraw Hill