The thickness, in mm, of metal washers is measured on samples of size 5. The following table presents the means, ranges, and standard deviations for 20 consecutive samples. Page 792 Sample 2.49 0.12 0.07 2 2.45 0.17 0.06 2.51 0.13 0.06 4 2.53 0.25 0.09 5 2.49 0.11 0.06 2.44 0.11 0.06 2.44 0.12 0.05 2.42 0.18 0.06 2.42 0.08 0.05 10 2.47 0.06 0.02 11 2.54 0.19 0.07 12 2.45 0.09 0.04 13 2.54 0.21 0.07 14 2.55 0.10 0.05 15 2.50 0.25 0.08 16 2.53 0.11 0.04 17 2.58 0.16 0.07 18 2.59 0.09 0.03 19 2.60 0.12 0.05 20 2.56 0.14 0.06 The means are X 2.505. R = 0.1395, and y = 0.057 Calculate the 30 control limits for the R chart. Is the variance under control? If not, delete the samples that are out of control and recompute X and R. Based on the sample range R, calculate the 30 control limits for the X chart. Based on a. b. the 30 limits, is the process mean in control? If not, when is it first detected to be out of control? Based on the Western Electric rules, is the process mean in control? If not, when is it first detected to be out of control? C.
The thickness, in mm, of metal washers is measured on samples of size 5. The following table presents the means, ranges, and standard deviations for 20 consecutive samples. Page 792 Sample 2.49 0.12 0.07 2 2.45 0.17 0.06 2.51 0.13 0.06 4 2.53 0.25 0.09 5 2.49 0.11 0.06 2.44 0.11 0.06 2.44 0.12 0.05 2.42 0.18 0.06 2.42 0.08 0.05 10 2.47 0.06 0.02 11 2.54 0.19 0.07 12 2.45 0.09 0.04 13 2.54 0.21 0.07 14 2.55 0.10 0.05 15 2.50 0.25 0.08 16 2.53 0.11 0.04 17 2.58 0.16 0.07 18 2.59 0.09 0.03 19 2.60 0.12 0.05 20 2.56 0.14 0.06 The means are X 2.505. R = 0.1395, and y = 0.057 Calculate the 30 control limits for the R chart. Is the variance under control? If not, delete the samples that are out of control and recompute X and R. Based on the sample range R, calculate the 30 control limits for the X chart. Based on a. b. the 30 limits, is the process mean in control? If not, when is it first detected to be out of control? Based on the Western Electric rules, is the process mean in control? If not, when is it first detected to be out of control? C.

Glencoe Algebra 1, Student Edition, 9780079039897, 0079039898, 2018
18th Edition
ISBN:9780079039897
Author:Carter
Publisher:Carter
Chapter10: Statistics
Section10.4: Distributions Of Data
Problem 19PFA

Related questions
Question
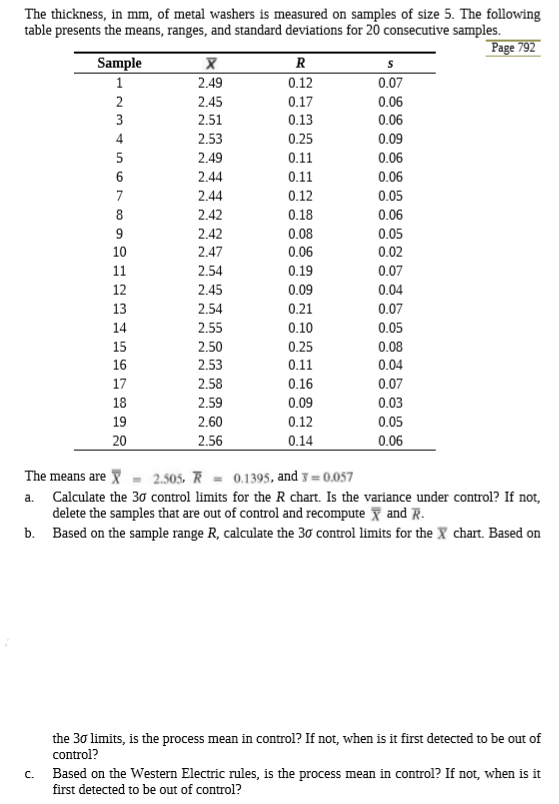
Transcribed Image Text:The thickness, in mm, of metal washers is measured on samples of size 5. The following
table presents the means, ranges, and standard deviations for 20 consecutive samples.
Page 792
Sample
2.49
0.12
0.07
2
2.45
0.17
0.06
2.51
0.13
0.06
4
2.53
0.25
0.09
5
2.49
0.11
0.06
2.44
0.11
0.06
2.44
0.12
0.05
2.42
0.18
0.06
2.42
0.08
0.05
10
2.47
0.06
0.02
11
2.54
0.19
0.07
12
2.45
0.09
0.04
13
2.54
0.21
0.07
14
2.55
0.10
0.05
15
2.50
0.25
0.08
16
2.53
0.11
0.04
17
2.58
0.16
0.07
18
2.59
0.09
0.03
19
2.60
0.12
0.05
20
2.56
0.14
0.06
The means are X
2.505. R = 0.1395, and y = 0.057
Calculate the 30 control limits for the R chart. Is the variance under control? If not,
delete the samples that are out of control and recompute X and R.
Based on the sample range R, calculate the 30 control limits for the X chart. Based on
a.
b.
the 30 limits, is the process mean in control? If not, when is it first detected to be out of
control?
Based on the Western Electric rules, is the process mean in control? If not, when is it
first detected to be out of control?
C.
Expert Solution
This question has been solved!
Explore an expertly crafted, step-by-step solution for a thorough understanding of key concepts.

This is a popular solution!

Trending now
This is a popular solution!

Step by step
Solved in 4 steps with 12 images

Recommended textbooks for you
Glencoe Algebra 1, Student Edition, 9780079039897…
Algebra
ISBN:
9780079039897
Author:
Carter
Publisher:
McGraw Hill
Glencoe Algebra 1, Student Edition, 9780079039897…
Algebra
ISBN:
9780079039897
Author:
Carter
Publisher:
McGraw Hill