The total blood cholesterol level was measured for each of 21 adults. Here are the 21 measurements (in mg/dL). 132, 144, 151, 153, 165, 167, 176, 180, 184, 184, 184, 194, 195, 196, 196, 210, 211, 214, 219, 234, 241 Send data to Excel Frequency 10- 8. 6- 4- 2- 125 175 Cholesterol level (in mg/dL) 150 200 225 250 (a) For these data, which measures of central tendency take more than one value? Choose all that apply. OMean OMedian OMode ONone of these measures (b) Suppose that the measurement 241 (the OMean largest measurement in the data set) were OMedian replaced by 351. Which measures of central tendency would be affected by the change? OMode Choose all that apply. ONone of these measures (c) Suppose that, starting with the original OMean data set, the smallest measurement were removed. Which measures of central tendency would be changed from those of the original data set? Choose all that apply. ONone of these measures OMedian OMode ONegatively skewed (d) Which of the following best describes the distribution of the original data? Choose only OPositively skewed one. ORoughly symmetrical
The total blood cholesterol level was measured for each of 21 adults. Here are the 21 measurements (in mg/dL). 132, 144, 151, 153, 165, 167, 176, 180, 184, 184, 184, 194, 195, 196, 196, 210, 211, 214, 219, 234, 241 Send data to Excel Frequency 10- 8. 6- 4- 2- 125 175 Cholesterol level (in mg/dL) 150 200 225 250 (a) For these data, which measures of central tendency take more than one value? Choose all that apply. OMean OMedian OMode ONone of these measures (b) Suppose that the measurement 241 (the OMean largest measurement in the data set) were OMedian replaced by 351. Which measures of central tendency would be affected by the change? OMode Choose all that apply. ONone of these measures (c) Suppose that, starting with the original OMean data set, the smallest measurement were removed. Which measures of central tendency would be changed from those of the original data set? Choose all that apply. ONone of these measures OMedian OMode ONegatively skewed (d) Which of the following best describes the distribution of the original data? Choose only OPositively skewed one. ORoughly symmetrical

Glencoe Algebra 1, Student Edition, 9780079039897, 0079039898, 2018
18th Edition
ISBN:9780079039897
Author:Carter
Publisher:Carter
Chapter10: Statistics
Section10.4: Distributions Of Data
Problem 19PFA

Related questions
Topic Video
Question
Transcribed Image Text:8:18
AA
www-awn.aleks.com
O DESCRIPTIVE STATISTICS
= Mean, median, and.
Shasia v
-
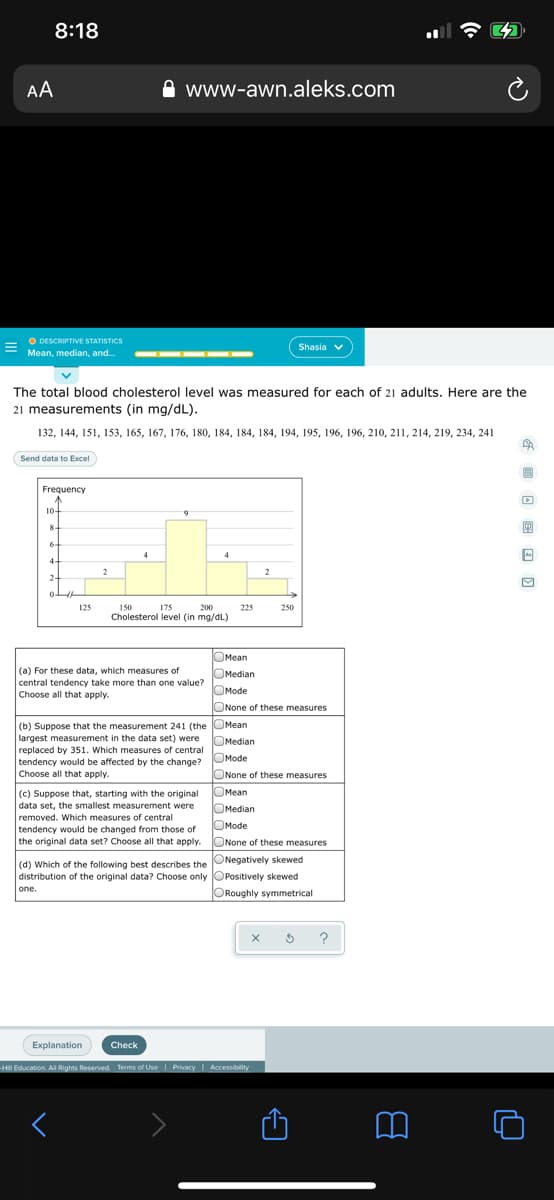
The total blood cholesterol level was measured for each of 21 adults. Here are the
21 measurements (in mg/dL).
132, 144, 151, 153, 165, 167, 176, 180, 184, 184, 184, 194, 195, 196, 196, 210, 211, 214, 219, 234, 241
(Send data to Excel
Frequency
10-
8-
6.
4
4
4-
2
2-
125
175
Cholesterol level (in mg/dL)
150
200
225
250
OMean
(a) For these data, which measures of
central tendency take more than one value?
Choose all that apply.
OMedian
OMode
ONone of these measures
(b) Suppose that the measurement 241 (the OMean
largest measurement in the data set) were
replaced by 351. Which measures of central
tendency would be affected by the change?
Choose all that apply.
OMedian
OMode
ONone of these measures
OMean
(c) Suppose that, starting with the original
data set, the smallest measurement were
removed. Which measures of central
tendency would be changed from those of
the original data set? Choose all that apply.
OMedian
OMode
ONone of these measures
(d) Which of the following best describes the Negatively skewed
distribution of the original data? Choose only OPositively skewed
one.
ORoughly symmetrical
?
Explanation
Check
Hill Education. AlI Rights Reserved Terms of Use Privacy Acessibility
回 日国国回
Transcribed Image Text:8:18
AA
www-awn.aleks.com
O DESCRPTIVE STATISTICS
---
Shasia
Mean, median, and mode: Comparisons
W ATION
The mean, the median, and the mode are measures of central tendency
of a distribution or data set. Recall that the mean of a data set is the
sum of the measurements in the data set divided by the number of
measurements in the data set, the median is the "middle" value when
the data have been ordered, and the mode is the measurement (or
measurements) with the highest frequency.
(a) We're asked which, if any, of the three measures of central tendency
do not exist for the data set. The mean and median always exist for a
data set. The mode exists for a data set except in the case that none of
the measurements in the data set is repeated, that is, in the case that
each number in the data set occurs with frequency one. Such is not the
case for the data set in the problem, so a mode exists. (The mode of the
data set is 69.) Therefore, all three measures of central tendency exist for
the data set.
(b) If 33, the smallest measurement in the data set, were replaced by 24,
then the mean of the data set would decrease (from about 60.9 to about
60.5). In fact, as you can check, replacing any measurement in the original
data set by any smaller value decreases the mean. However, replacing 33
by 24 would not change the median, since the median does not depend
on the actual value of the smallest measurement (but only on the fact
that the smallest measurement is the smallest measurement). In general, we
say that the median is resistant to extreme values, but the mean is not.
The modes for this data set would not change because 33 is not a mode
and replacing it by 24, a value not in the original data set, would not
affect the frequency of the other values.
(c) If the largest measurement, which is 77, were removed from the
original data set, then the mean would necessarily decrease. In fact,
removing any measurement larger than the mean of the data set will
cause the mean to decrease. (Here, the mean decreases from about 60.9
to about 60.1.) In this case, the median also is affected. In particular, the
median changes from 63 to 62 when the measurement is removed. The
mode does not change when the measurement is removed.
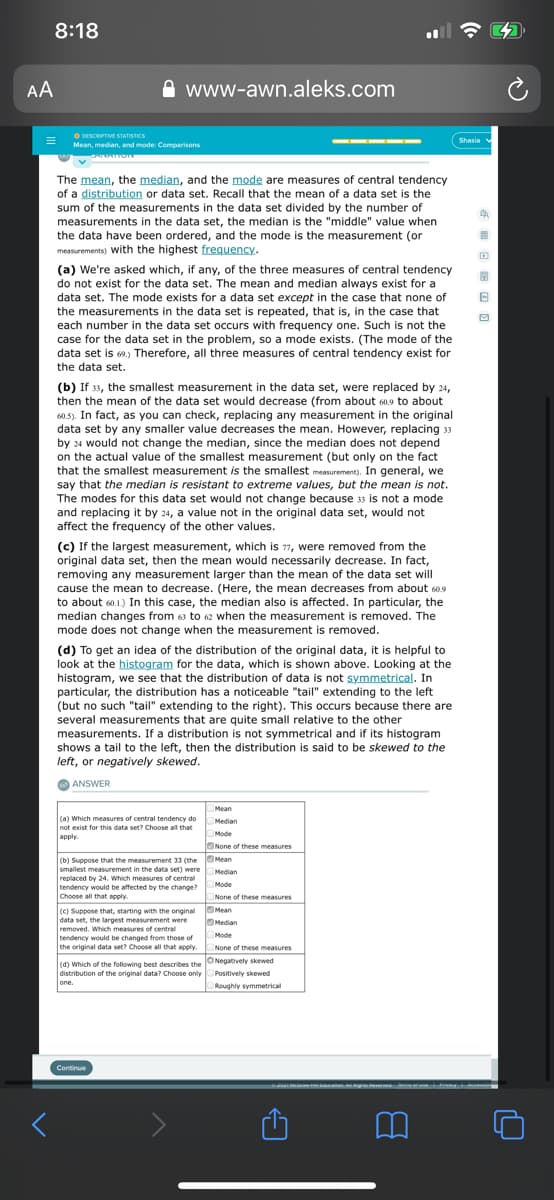
(d) To get an idea of the distribution of the original data, it is helpful to
look at the histogram for the data, which is shown above. Looking at the
histogram, we see that the distribution of data is not symmetrical. In
particular, the distribution has a noticeable "tail" extending to the left
(but no such "tail" extending to the right). This occurs because there are
several measurements that are quite small relative to the other
measurements. If a distribution is not symmetrical and if its histogram
shows a tail to the left, then the distribution is said to be skewed to the
left, or negatively skewed.
O ANSWER
Mean
(a) Which measures of central tendency do
not exist for this data set? Choose all that
apply.
Median
Mode
ONone of these measures
(b) Suppose that the measurement 33 (the Mean
smallest measurement in the data set) were
Median
replaced by 24. Which measures of central
tendency would be affected by the change?
Mode
Choose all that apply.
None of these measures
(e) Suppose that, starting with the original OMean
data set, the largest measurement were
removed. Which measures of central
tendency would be changed from those of
the original data set? Choose all that apply.
OMedian
Mode
None of these measures
JONegatively skewed
(d) Which of the following best describes the
distribution of the original data? Choose only OPositively skewed
one.
Roughly symmetrical
Continue
Expert Solution
This question has been solved!
Explore an expertly crafted, step-by-step solution for a thorough understanding of key concepts.

This is a popular solution!

Trending now
This is a popular solution!

Step by step
Solved in 3 steps

Knowledge Booster


Learn more about
Need a deep-dive on the concept behind this application? Look no further. Learn more about this topic, statistics and related others by exploring similar questions and additional content below.Recommended textbooks for you
Glencoe Algebra 1, Student Edition, 9780079039897…
Algebra
ISBN:
9780079039897
Author:
Carter
Publisher:
McGraw Hill
Glencoe Algebra 1, Student Edition, 9780079039897…
Algebra
ISBN:
9780079039897
Author:
Carter
Publisher:
McGraw Hill