The types of browse favored by deer are shown in the following table. Using binoculars, volunteers observed the feeding habits of a random sample of 320 deer. Type of Browse Sage brush Rabbit brush Plant Composition in Study Area 32% Observed Number of Deer Feeding on This Plant 106 38.7% 113 Salt brush 12% 42 Service berry Other 9.3% 31 8% 28 A USE SALT Use a 5% level of significance to test the claim that the natural distribution of browse fits the deer feeding pattern. (a) What is the level of significance? State the null and alternate hypotheses. O Ho: The distributions are the same. H,: The distributions are the same. O Ho: The distributions are different. H: The distributions are different. O Ho: The distributions are the same. H,: The distributions are different. O Ho: The distributions are different. H: The distributions are the same. (b) Find the value of the chi-square statistic for the sample. (Round the expected frequencies to at least three decimal places. Round the test statistic to three decimal places.) Are all the expected frequencies greater than 5? Yes O No What sampling distribution will you use? O binomial O normal O chi-square O Student's t O uniform What are the degrees of freedom?
The types of browse favored by deer are shown in the following table. Using binoculars, volunteers observed the feeding habits of a random sample of 320 deer. Type of Browse Sage brush Rabbit brush Plant Composition in Study Area 32% Observed Number of Deer Feeding on This Plant 106 38.7% 113 Salt brush 12% 42 Service berry Other 9.3% 31 8% 28 A USE SALT Use a 5% level of significance to test the claim that the natural distribution of browse fits the deer feeding pattern. (a) What is the level of significance? State the null and alternate hypotheses. O Ho: The distributions are the same. H,: The distributions are the same. O Ho: The distributions are different. H: The distributions are different. O Ho: The distributions are the same. H,: The distributions are different. O Ho: The distributions are different. H: The distributions are the same. (b) Find the value of the chi-square statistic for the sample. (Round the expected frequencies to at least three decimal places. Round the test statistic to three decimal places.) Are all the expected frequencies greater than 5? Yes O No What sampling distribution will you use? O binomial O normal O chi-square O Student's t O uniform What are the degrees of freedom?

Glencoe Algebra 1, Student Edition, 9780079039897, 0079039898, 2018
18th Edition
ISBN:9780079039897
Author:Carter
Publisher:Carter
Chapter10: Statistics
Section10.6: Summarizing Categorical Data
Problem 10CYU

Related questions
Question
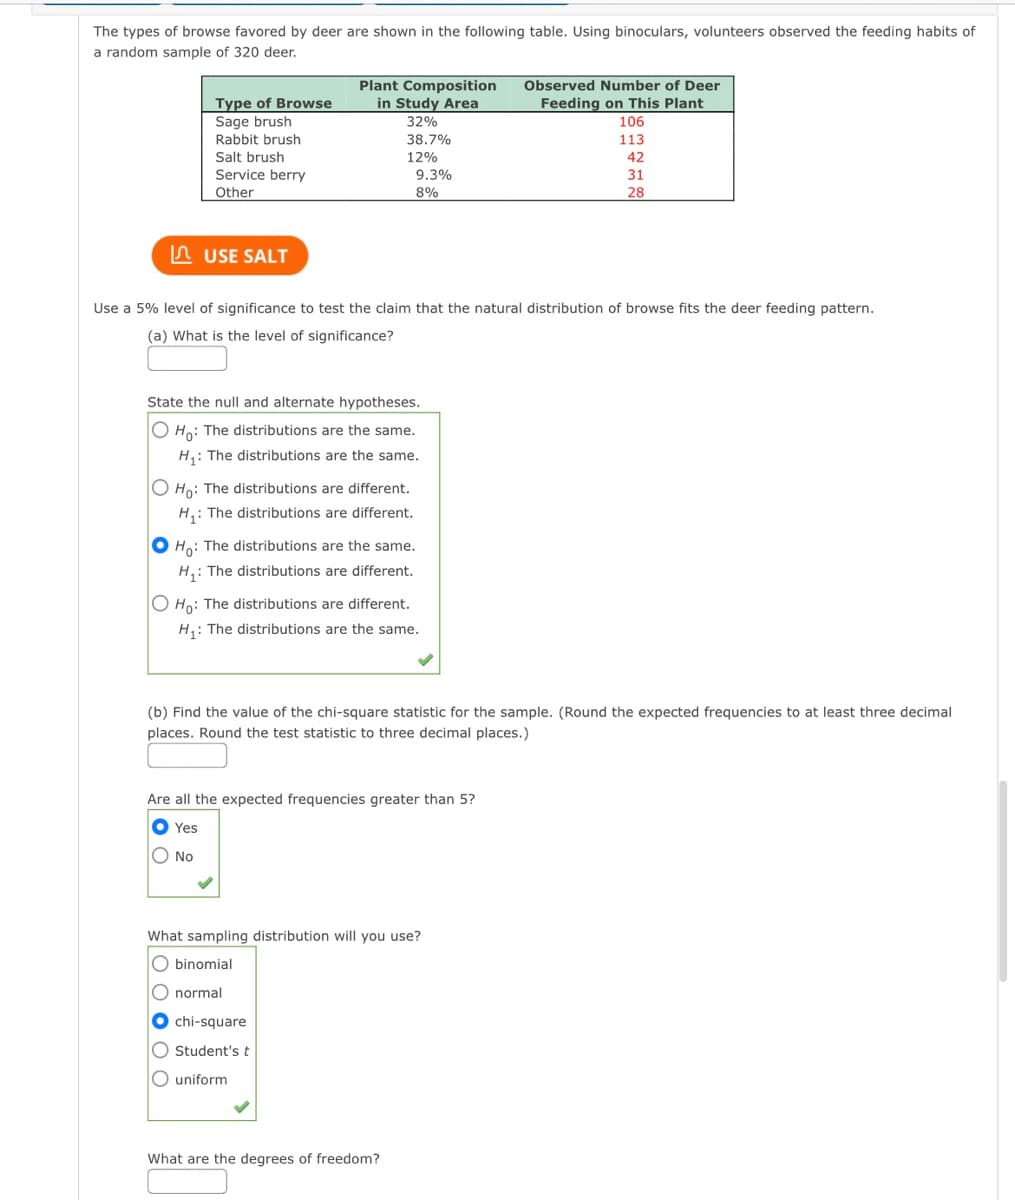
Transcribed Image Text:The types of browse favored by deer are shown in the following table. Using binoculars, volunteers observed the feeding habits of
a random sample of 320 deer.
Plant Composition
in Study Area
Observed Number of Deer
Type of Browse
Sage brush
Feeding on This Plant
32%
106
Rabbit brush
Salt brush
38.7%
113
12%
42
Service berry
Other
9.3%
31
8%
28
n USE SALT
Use a 5% level of significance to test the claim that the natural distribution of browse fits the deer feeding pattern.
(a) What is the level of significance?
State the null and alternate hypotheses.
O Ho: The distributions are the same.
H,: The distributions are the same.
O Ho: The distributions are different.
H,: The distributions are different.
O Ho: The distributions are the same.
H,: The distributions are different.
O Ho: The distributions are different.
H,: The distributions are the same.
(b) Find the value of the chi-square statistic for the sample. (Round the expected frequencies to at least three decimal
places. Round the test statistic to three decimal places.)
Are all the expected frequencies greater than 5?
O Yes
O No
What sampling distribution will you use?
O binomial
normal
O chi-square
Student's t
O uniform
What are the degrees of freedom?
Expert Solution
This question has been solved!
Explore an expertly crafted, step-by-step solution for a thorough understanding of key concepts.

This is a popular solution!

Trending now
This is a popular solution!

Step by step
Solved in 4 steps

Recommended textbooks for you
Glencoe Algebra 1, Student Edition, 9780079039897…
Algebra
ISBN:
9780079039897
Author:
Carter
Publisher:
McGraw Hill
Glencoe Algebra 1, Student Edition, 9780079039897…
Algebra
ISBN:
9780079039897
Author:
Carter
Publisher:
McGraw Hill