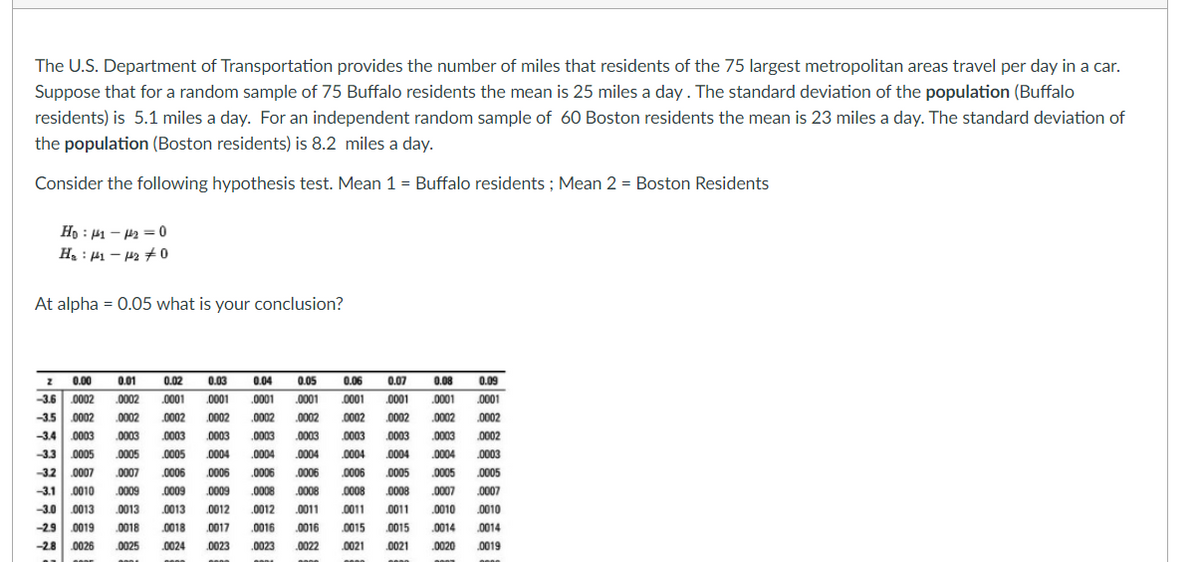
The U.S. Department of Transportation provides the number of miles that residents of the 75 largest metropolitan areas travel per day in a car. Suppose that for a random sample of 75 Buffalo residents the mean is 25 miles a day. The standard deviation of the population (Buffalo residents) is 5.1 miles a day. For an independent random sample of 60 Boston residents the mean is 23 miles a day. The standard deviation of the population (Boston residents) is 8.2 miles a day. Consider the following hypothesis test. Mean 1 = Buffalo residents ; Mean 2 = Boston Residents Ho : H1 - H2 = 0 H : 1 – 42 +0 At alpha = 0.05 what is your conclusion?


Inverse Normal Distribution
The method used for finding the corresponding z-critical value in a normal distribution using the known probability is said to be an inverse normal distribution. The inverse normal distribution is a continuous probability distribution with a family of two parameters.
Mean, Median, Mode
It is a descriptive summary of a data set. It can be defined by using some of the measures. The central tendencies do not provide information regarding individual data from the dataset. However, they give a summary of the data set. The central tendency or measure of central tendency is a central or typical value for a probability distribution.
Z-Scores
A z-score is a unit of measurement used in statistics to describe the position of a raw score in terms of its distance from the mean, measured with reference to standard deviation from the mean. Z-scores are useful in statistics because they allow comparison between two scores that belong to different normal distributions.


Trending now
This is a popular solution!

Step by step
Solved in 3 steps with 2 images


