Before Specialization Corn Production Rice Production (Tons per year) (Tons per year) United States (at point B) 100 25 Venezuela (at point C) 60 40 Total World Output After Specialization United States 0 75 Venezuela 180 0 Total World Output Total world output of corn has increased by specialization. tons, and the total output of rice has increased by tons, as a result of On the following graph, use the blue points (circle symbol) to plot the PPC for the United States and the green points (triangle symbol) to plot the PPC for Venezuela. Next, suppose that both countries specialize in the good for which they have a comparative advantage and then trade 50 tons of rice for 120 tons of corn. Use the grey point (star symbol) to plot the post-specialization and trade level of consumption for the United States. Use the orange point (square symbol) to plot the post-specialization and trade level of consumption for Venezuela. RICE (Tons) 75 50 25 0 25 50 100 125 150 175 CORN (Tons) United States PPF Venezuela PPF United States Post-Trade Consumption Venezuela Post-Trade Consumption After specialization and trading at the stated rates, both nations are now consuming both nations are off. their production possibilities curves. As a result, The United States and Venezuela produce corn and rice. The following production possibilities schedule describes their potential output in tons per year. Using the data in the table, answer the questions that follow. Point on the Production Possibilities Curve A B C D United States Corn Rice Venezuela Corn Rice (Tons per year) (Tons per year) (Tons per year) (Tons per year) 150 0 180 0 100 25 120 20 50 50 60 40 0 75 0 60 The opportunity cost of producing corn in the United States is approximately Venezuela is approximately tons of rice. tons of rice, and the opportunity cost of producing corn in The opportunity cost of producing 1 ton of rice in the United States is approximately rice in Venezuela is approximately tons of corn. tons of corn, and the opportunity cost of producing 1 ton of The United States has the comparative advantage in Venezuela has the comparative advantage in Suppose the United States is producing and consuming at point B on its production possibilities curve, and Venezuela is producing and consuming at point C on its production possibilities curve. Calculate the production of both corn and rice before and after specialization and enter those values in the following table. Corn Production Rice Production (Tons per year) (Tons per year) Before Specialization United States (at point B) 100 25 Venezuela (at point C) 60 40 Total World Output After Specialization United States 0 75
Before Specialization Corn Production Rice Production (Tons per year) (Tons per year) United States (at point B) 100 25 Venezuela (at point C) 60 40 Total World Output After Specialization United States 0 75 Venezuela 180 0 Total World Output Total world output of corn has increased by specialization. tons, and the total output of rice has increased by tons, as a result of On the following graph, use the blue points (circle symbol) to plot the PPC for the United States and the green points (triangle symbol) to plot the PPC for Venezuela. Next, suppose that both countries specialize in the good for which they have a comparative advantage and then trade 50 tons of rice for 120 tons of corn. Use the grey point (star symbol) to plot the post-specialization and trade level of consumption for the United States. Use the orange point (square symbol) to plot the post-specialization and trade level of consumption for Venezuela. RICE (Tons) 75 50 25 0 25 50 100 125 150 175 CORN (Tons) United States PPF Venezuela PPF United States Post-Trade Consumption Venezuela Post-Trade Consumption After specialization and trading at the stated rates, both nations are now consuming both nations are off. their production possibilities curves. As a result, The United States and Venezuela produce corn and rice. The following production possibilities schedule describes their potential output in tons per year. Using the data in the table, answer the questions that follow. Point on the Production Possibilities Curve A B C D United States Corn Rice Venezuela Corn Rice (Tons per year) (Tons per year) (Tons per year) (Tons per year) 150 0 180 0 100 25 120 20 50 50 60 40 0 75 0 60 The opportunity cost of producing corn in the United States is approximately Venezuela is approximately tons of rice. tons of rice, and the opportunity cost of producing corn in The opportunity cost of producing 1 ton of rice in the United States is approximately rice in Venezuela is approximately tons of corn. tons of corn, and the opportunity cost of producing 1 ton of The United States has the comparative advantage in Venezuela has the comparative advantage in Suppose the United States is producing and consuming at point B on its production possibilities curve, and Venezuela is producing and consuming at point C on its production possibilities curve. Calculate the production of both corn and rice before and after specialization and enter those values in the following table. Corn Production Rice Production (Tons per year) (Tons per year) Before Specialization United States (at point B) 100 25 Venezuela (at point C) 60 40 Total World Output After Specialization United States 0 75

Principles of Economics 2e
2nd Edition
ISBN:9781947172364
Author:Steven A. Greenlaw; David Shapiro
Publisher:Steven A. Greenlaw; David Shapiro
Chapter33: International Trade
Section: Chapter Questions
Problem 31P: Review the numbers for Canada and Venezuela from Table 33.12 which describes how many barrels of oil...
Question
100%
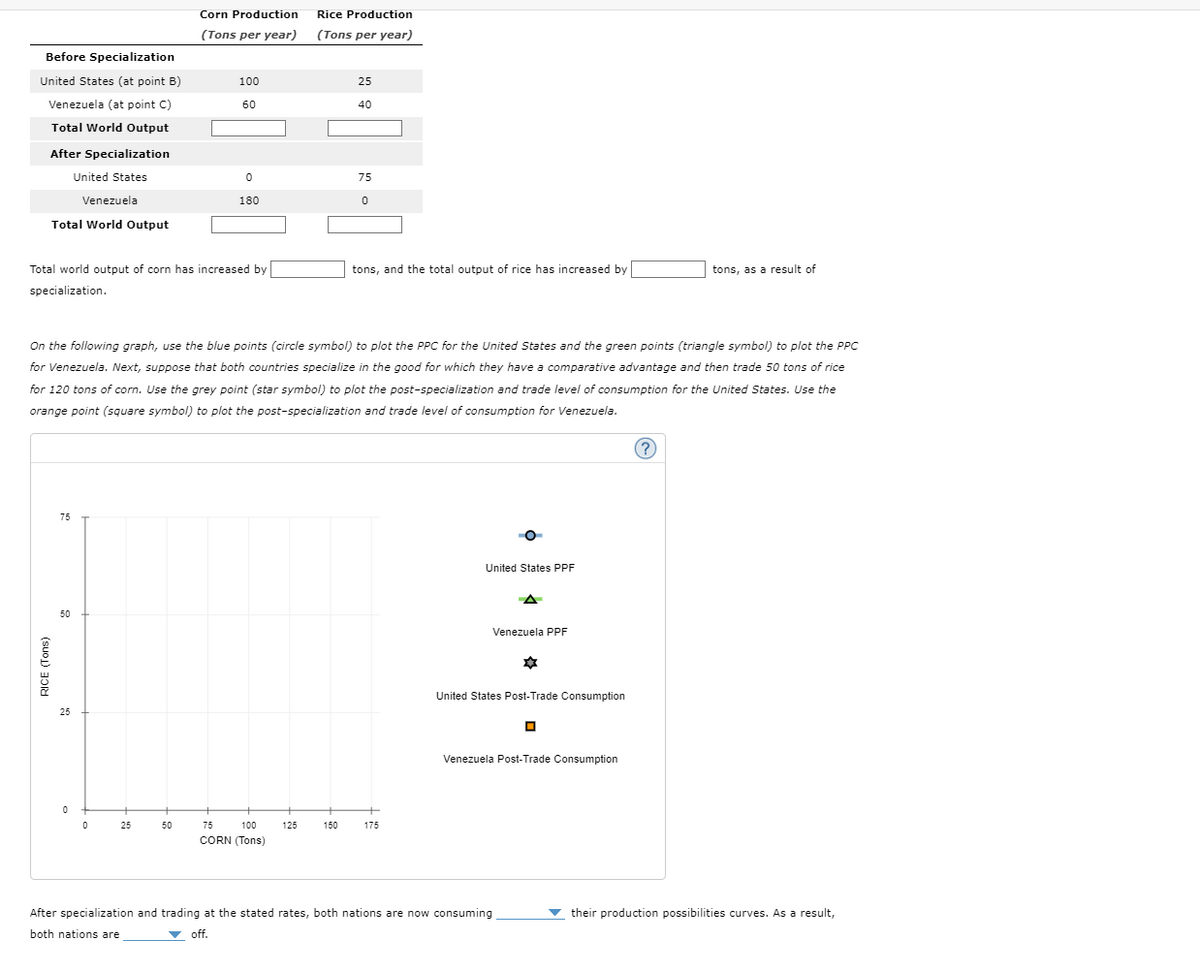
Transcribed Image Text:Before Specialization
Corn Production
Rice Production
(Tons per year) (Tons per year)
United States (at point B)
100
25
Venezuela (at point C)
60
40
Total World Output
After Specialization
United States
0
75
Venezuela
180
0
Total World Output
Total world output of corn has increased by
specialization.
tons, and the total output of rice has increased by
tons, as a result of
On the following graph, use the blue points (circle symbol) to plot the PPC for the United States and the green points (triangle symbol) to plot the PPC
for Venezuela. Next, suppose that both countries specialize in the good for which they have a comparative advantage and then trade 50 tons of rice
for 120 tons of corn. Use the grey point (star symbol) to plot the post-specialization and trade level of consumption for the United States. Use the
orange point (square symbol) to plot the post-specialization and trade level of consumption for Venezuela.
RICE (Tons)
75
50
25
0
25
50
100
125
150
175
CORN (Tons)
United States PPF
Venezuela PPF
United States Post-Trade Consumption
Venezuela Post-Trade Consumption
After specialization and trading at the stated rates, both nations are now consuming
both nations are
off.
their production possibilities curves. As a result,
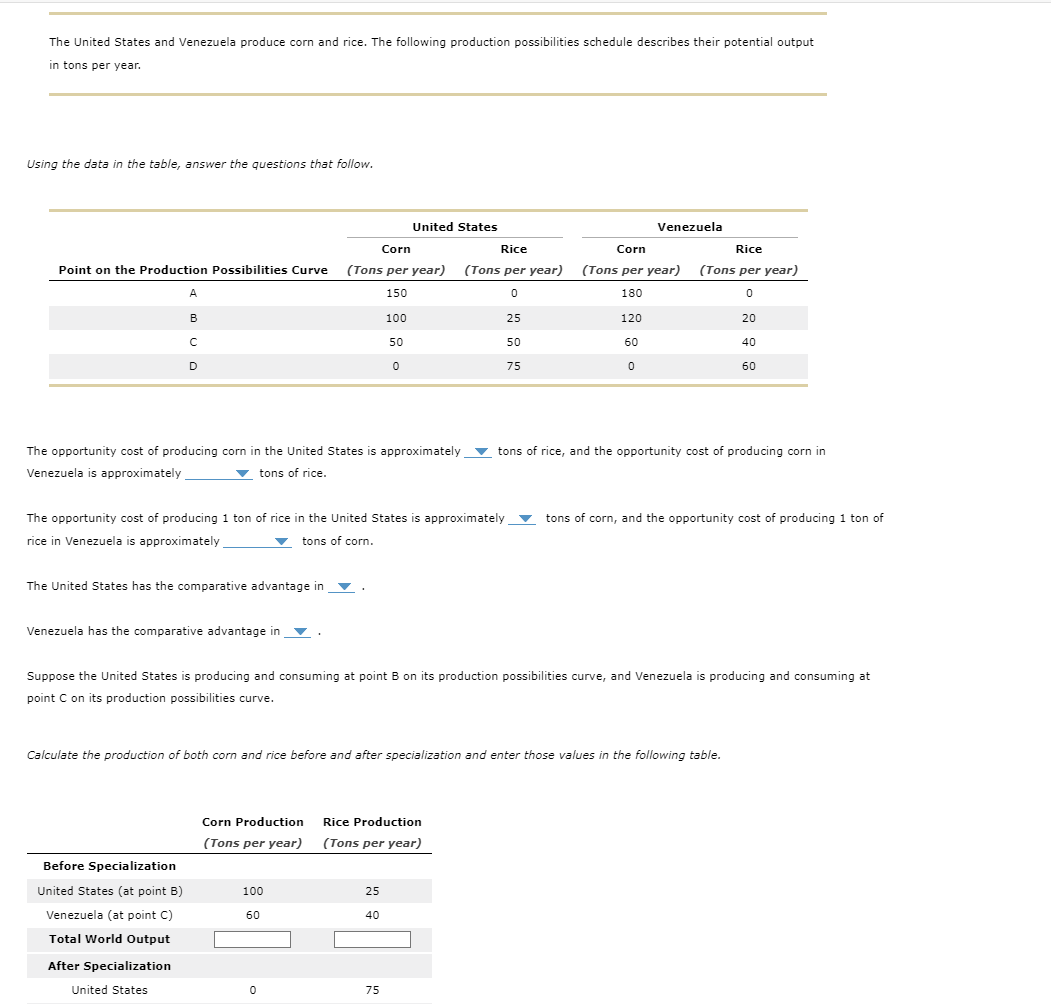
Transcribed Image Text:The United States and Venezuela produce corn and rice. The following production possibilities schedule describes their potential output
in tons per year.
Using the data in the table, answer the questions that follow.
Point on the Production Possibilities Curve
A
B
C
D
United States
Corn
Rice
Venezuela
Corn
Rice
(Tons per year) (Tons per year) (Tons per year) (Tons per year)
150
0
180
0
100
25
120
20
50
50
60
40
0
75
0
60
The opportunity cost of producing corn in the United States is approximately
Venezuela is approximately
tons of rice.
tons of rice, and the opportunity cost of producing corn in
The opportunity cost of producing 1 ton of rice in the United States is approximately
rice in Venezuela is approximately
tons of corn.
tons of corn, and the opportunity cost of producing 1 ton of
The United States has the comparative advantage in
Venezuela has the comparative advantage in
Suppose the United States is producing and consuming at point B on its production possibilities curve, and Venezuela is producing and consuming at
point C on its production possibilities curve.
Calculate the production of both corn and rice before and after specialization and enter those values in the following table.
Corn Production
Rice Production
(Tons per year) (Tons per year)
Before Specialization
United States (at point B)
100
25
Venezuela (at point C)
60
40
Total World Output
After Specialization
United States
0
75
Expert Solution
This question has been solved!
Explore an expertly crafted, step-by-step solution for a thorough understanding of key concepts.

This is a popular solution!

Trending now
This is a popular solution!

Step by step
Solved in 2 steps with 2 images

Recommended textbooks for you
Principles of Economics 2e
Economics
ISBN:
9781947172364
Author:
Steven A. Greenlaw; David Shapiro
Publisher:
OpenStax


Principles of Economics 2e
Economics
ISBN:
9781947172364
Author:
Steven A. Greenlaw; David Shapiro
Publisher:
OpenStax

Brief Principles of Macroeconomics (MindTap Cours…
Economics
ISBN:
9781337091985
Author:
N. Gregory Mankiw
Publisher:
Cengage Learning

Essentials of Economics (MindTap Course List)
Economics
ISBN:
9781337091992
Author:
N. Gregory Mankiw
Publisher:
Cengage Learning
