The US economy continued its robust recovery during the second quarter in 2021, allaying fears the coronavirus pandemic had permanently plunged the economy into recession. The second-quarter surge in economic activity was driven by consumer spending, which showed 24.6% increase. In addition to the increase in personal consumption, business investment rose by 9%, with subcomponents in structures and equipment each growing. Government spending rose a modest 2.7%, in large measure due to stimulus spending under President Biden and the Democratic Congress to help suffering households and businesses. The spike in GDP was accompanied by a drop in the unemployment rate, with the 2nd Quarter unemployment rate at 5.4%. And the Fed reported the nation’s capital utilization rate in the 2nd quarter ticked upward to 68%. Please reproduce the graph 4A. Reproduce Figure 1.3 from Module 1--The Keynesian Model of an economy below its level of potential output. Label the aggregate demand curve “AD, 21” (signifying aggregate demand in the second quarter of 2021)and set out economic output on the horizontal axis as Y21.


Bureau of Economic Analysis—July 30, 2021
The US economy continued its robust recovery during the second quarter in 2021, allaying fears the coronavirus pandemic had permanently plunged the economy into recession. The second-quarter surge in economic activity was driven by consumer spending, which showed 24.6% increase. In addition to the increase in personal consumption, business investment rose by 9%, with subcomponents in structures and equipment each growing. Government spending rose a modest 2.7%, in large measure due to stimulus spending under President Biden and the Democratic Congress to help suffering households and businesses. The spike in
Please reproduce the graph
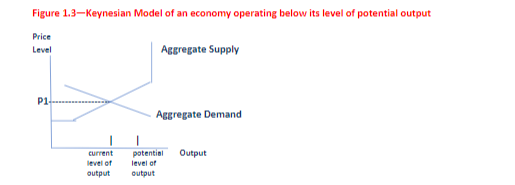
4A. Reproduce Figure 1.3 from Module 1--The Keynesian Model of an economy below its level of potential output. Label the aggregate
5. In 2019, the unemployment rate was 4.5% and capital utilization rate was 75%. Without adjusting potential GDP, return to Figure 1.3 drawn in 4A and insert an aggregate demand curve that represents aggregate demand as of 2019, labeling the curve “AD, 19” (signifying aggregate demand in 2019) and set out economic output on the horizontal axis as Y19.

Step by step
Solved in 2 steps with 2 images
