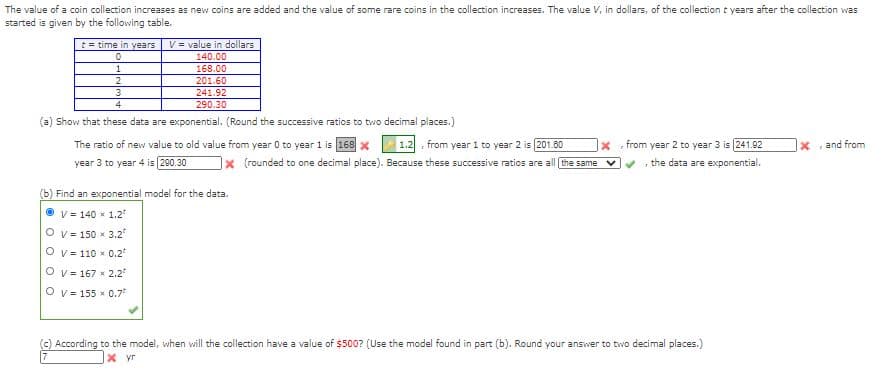
The value of a coin collection increases as new coins are added and the value of some rare coins in the collection increases. The value V, in dollars, of the collectiont years after the collection was started is given by the following table. t = time in years V = value in dollars 140.00 1. 2 168.00 201.60 241.92 4 290.30 (a) Show that these data are exponential. (Round the successive ratios to two decimal places.) 1.2 , from year 1 to year 2 is 201.60 1x (rounded to one decimal place). Because these successive ratios are all the same The ratio of new value to old value from year 0 to year 1 is 168 x from year 2 to year 3 is 241.02 X and from year 3 to year 4 is 200.30 the data are exponential. (b) Find an exponential model for the data. V = 140 x 1.2 O v = 150 x 3.2 O v = 110 x 0.2 O v = 167 x 2.2 O v = 155 x 0.7 (c) According to the model, when will the collection have a value of $500? (Use the model found in part (b). Round your answer to two decimal places.) X yr
The value of a coin collection increases as new coins are added and the value of some rare coins in the collection increases. The value V, in dollars, of the collectiont years after the collection was started is given by the following table. t = time in years V = value in dollars 140.00 1. 2 168.00 201.60 241.92 4 290.30 (a) Show that these data are exponential. (Round the successive ratios to two decimal places.) 1.2 , from year 1 to year 2 is 201.60 1x (rounded to one decimal place). Because these successive ratios are all the same The ratio of new value to old value from year 0 to year 1 is 168 x from year 2 to year 3 is 241.02 X and from year 3 to year 4 is 200.30 the data are exponential. (b) Find an exponential model for the data. V = 140 x 1.2 O v = 150 x 3.2 O v = 110 x 0.2 O v = 167 x 2.2 O v = 155 x 0.7 (c) According to the model, when will the collection have a value of $500? (Use the model found in part (b). Round your answer to two decimal places.) X yr

Chapter6: Exponential And Logarithmic Functions
Section6.8: Fitting Exponential Models To Data
Problem 2TI: Sales of a video game released in the year 2000 took off at first, but then steadily slowed as time...

Related questions

Concept explainers
Contingency Table
A contingency table can be defined as the visual representation of the relationship between two or more categorical variables that can be evaluated and registered. It is a categorical version of the scatterplot, which is used to investigate the linear relationship between two variables. A contingency table is indeed a type of frequency distribution table that displays two variables at the same time.
Binomial Distribution
Binomial is an algebraic expression of the sum or the difference of two terms. Before knowing about binomial distribution, we must know about the binomial theorem.
Topic Video
Question
5
Transcribed Image Text:The value of a coin collection increases as new coins are added and the value of some rare coins in the collection increases. The value V, in dollars, of the collectiont years after the collection was
started is given by the following table.
t = time in years
V = value in dollars
0.
140.00
1.
2
168.00
201.60
241.92
4
290.30
(a) Show that these data are exponential. (Round the successive ratios to two decimal places.)
1.2 , from year 1 to year 2 is 201.60
1x (rounded to one decimal place). Because these successive ratios are all the same
The ratio of new value to old value from year 0 to year 1 is 168 x
from year 2 to year 3 is 241.02
X and from
year 3 to year 4 is 200.30
the data are exponential.
(b) Find an exponential model for the data.
V = 140 x 1.2
O v = 150 x 3.2
O v = 110 x 0.2
O v = 167 x 2.2
Ov = 155 x 0.7
(c) According to the model, when will the collection have a value of $500? (Use the model found in part (b). Round your answer to two decimal places.)
X yr
Expert Solution
This question has been solved!
Explore an expertly crafted, step-by-step solution for a thorough understanding of key concepts.

This is a popular solution!

Trending now
This is a popular solution!

Step by step
Solved in 2 steps with 2 images

Knowledge Booster


Learn more about
Need a deep-dive on the concept behind this application? Look no further. Learn more about this topic, advanced-math and related others by exploring similar questions and additional content below.Recommended textbooks for you

Linear Algebra: A Modern Introduction
Algebra
ISBN:
9781285463247
Author:
David Poole
Publisher:
Cengage Learning

Algebra & Trigonometry with Analytic Geometry
Algebra
ISBN:
9781133382119
Author:
Swokowski
Publisher:
Cengage
Linear Algebra: A Modern Introduction
Algebra
ISBN:
9781285463247
Author:
David Poole
Publisher:
Cengage Learning
Algebra & Trigonometry with Analytic Geometry
Algebra
ISBN:
9781133382119
Author:
Swokowski
Publisher:
Cengage

Algebra and Trigonometry (MindTap Course List)
Algebra
ISBN:
9781305071742
Author:
James Stewart, Lothar Redlin, Saleem Watson
Publisher:
Cengage Learning

College Algebra
Algebra
ISBN:
9781305115545
Author:
James Stewart, Lothar Redlin, Saleem Watson
Publisher:
Cengage Learning
