The value of this graph as is becoming clear! Now let's consider a case in which the relationship between variables is direct, or positive. The table in Figure 1.7 presents data comparing ice cream cone sales to outdoor temperatures. When temperature increases, so do ice cream cone sales, reflecting a direct relationship. Number of Point on Temperature Cones Sold Graph 12°C 20 000 24°C 50 000 Y 32°C 70 000 Figure 1.7 lce cream cone sales relative to temperature.
The value of this graph as is becoming clear! Now let's consider a case in which the relationship between variables is direct, or positive. The table in Figure 1.7 presents data comparing ice cream cone sales to outdoor temperatures. When temperature increases, so do ice cream cone sales, reflecting a direct relationship. Number of Point on Temperature Cones Sold Graph 12°C 20 000 24°C 50 000 Y 32°C 70 000 Figure 1.7 lce cream cone sales relative to temperature.

Chapter1: Introducing The Economic Way Of Thinking
Section1.A: Applying Graphs To Economics
Problem 2SQP

Related questions
Question
Draw and label the economic model.
Transcribed Image Text:UNIT 1:
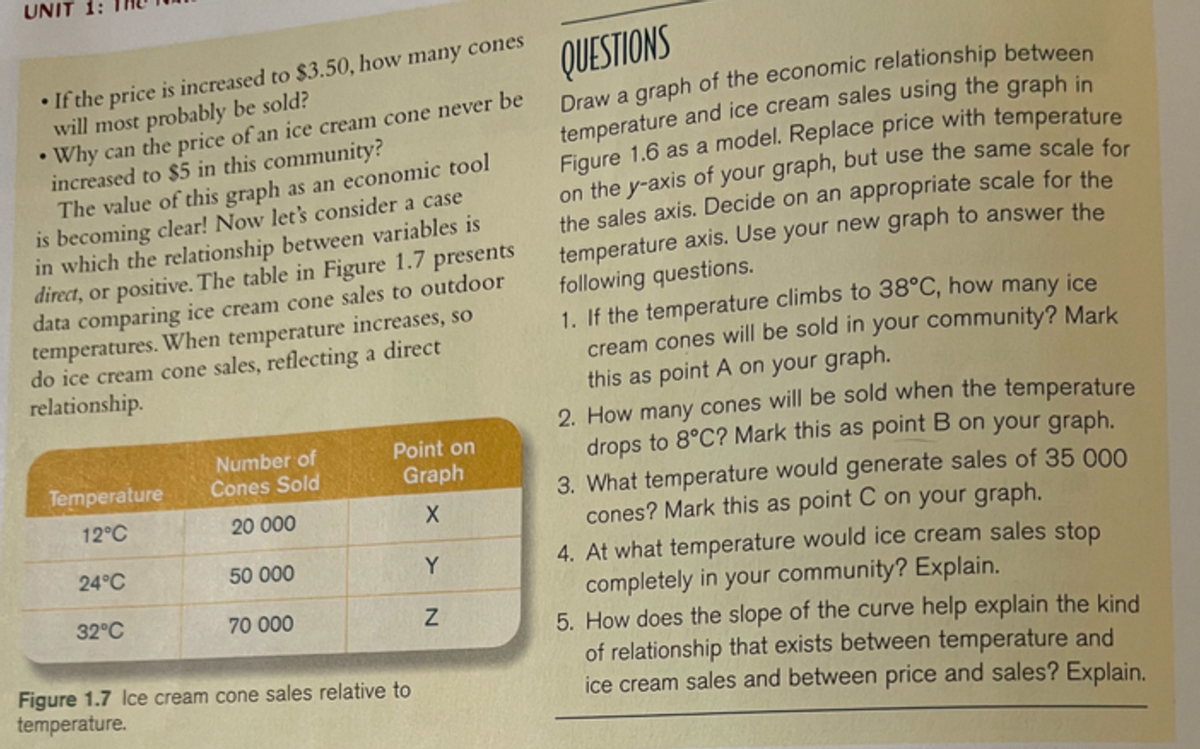
• If the price is increased to $3.50, how many cones
will most probably be sold?
• Why can the price of an ice cream cone never be
increased to $5 in this community?
The value of this graph as an economic tool
is becoming clear! Now let's consider a case
in which the relationship between variables is
direct, or positive. The table in Figure 1.7 presents
data comparing ice cream cone sales to outdoor
temperatures. When temperature increases, so
do ice cream cone sales, reflecting a direct
relationship.
QUESTIONS
temperature and ice cream sales using the graph in
the sales axis. Decide on an appropriate scale for the
temperature axis. Use your new graph to answer the
following questions.
1. If the temperature climbs to 38°C, how many ice
cream cones will be sold in your community? Mark
this as point A on your graph.
2. How many cones will be sold when the temperature
drops to 8°C? Mark this as point B on your graph.
3. What temperature would generate sales of 35 000
cones? Mark this as point C on your graph.
4. At what temperature would ice cream sales stop
completely in your community? Explain.
5. How does the slope of the curve help explain the kind
of relationship that exists between temperature and
ice cream sales and between price and sales? Explain.
Point on
Number of
Cones Sold
Temperature
Graph
12°C
20 000
24°C
50 000
Y
32°C
70 000
Figure 1.7 Ice cream cone sales relative to
temperature.
Expert Solution
This question has been solved!
Explore an expertly crafted, step-by-step solution for a thorough understanding of key concepts.

Step by step
Solved in 3 steps with 2 images

Knowledge Booster


Learn more about
Need a deep-dive on the concept behind this application? Look no further. Learn more about this topic, economics and related others by exploring similar questions and additional content below.Recommended textbooks for you


Principles of Economics 2e
Economics
ISBN:
9781947172364
Author:
Steven A. Greenlaw; David Shapiro
Publisher:
OpenStax