The values listed below are waiting times (in minutes) of customers at two different banks. At Bank A, customers enter a single waiting line that feeds three teller windows. At Bank B, customers ma enter any one of three different lines that have formed at three teller windows. Answer the following questions. Bank A 6.4 6.6 6.7 6.8 7.1 7.3 7.5 7.8 7.8 7.8 Bank B 4.3 5.5 5.8 6.1 6.6 7.7 7.7 8.5 9.4 10.0 Click the icon to view the table of Chi-Square critical values. Construct a 90% confidence interval for the population standard deviation o at Bank A. min < OBank A min (Round to two decimal places as needed.) Construct a 90% confidence interval for the population standard deviation o at Bank B. min
The values listed below are waiting times (in minutes) of customers at two different banks. At Bank A, customers enter a single waiting line that feeds three teller windows. At Bank B, customers ma enter any one of three different lines that have formed at three teller windows. Answer the following questions. Bank A 6.4 6.6 6.7 6.8 7.1 7.3 7.5 7.8 7.8 7.8 Bank B 4.3 5.5 5.8 6.1 6.6 7.7 7.7 8.5 9.4 10.0 Click the icon to view the table of Chi-Square critical values. Construct a 90% confidence interval for the population standard deviation o at Bank A. min < OBank A min (Round to two decimal places as needed.) Construct a 90% confidence interval for the population standard deviation o at Bank B. min

Glencoe Algebra 1, Student Edition, 9780079039897, 0079039898, 2018
18th Edition
ISBN:9780079039897
Author:Carter
Publisher:Carter
Chapter10: Statistics
Section10.5: Comparing Sets Of Data
Problem 26PFA

Related questions

Concept explainers
Contingency Table
A contingency table can be defined as the visual representation of the relationship between two or more categorical variables that can be evaluated and registered. It is a categorical version of the scatterplot, which is used to investigate the linear relationship between two variables. A contingency table is indeed a type of frequency distribution table that displays two variables at the same time.
Binomial Distribution
Binomial is an algebraic expression of the sum or the difference of two terms. Before knowing about binomial distribution, we must know about the binomial theorem.
Topic Video
Question
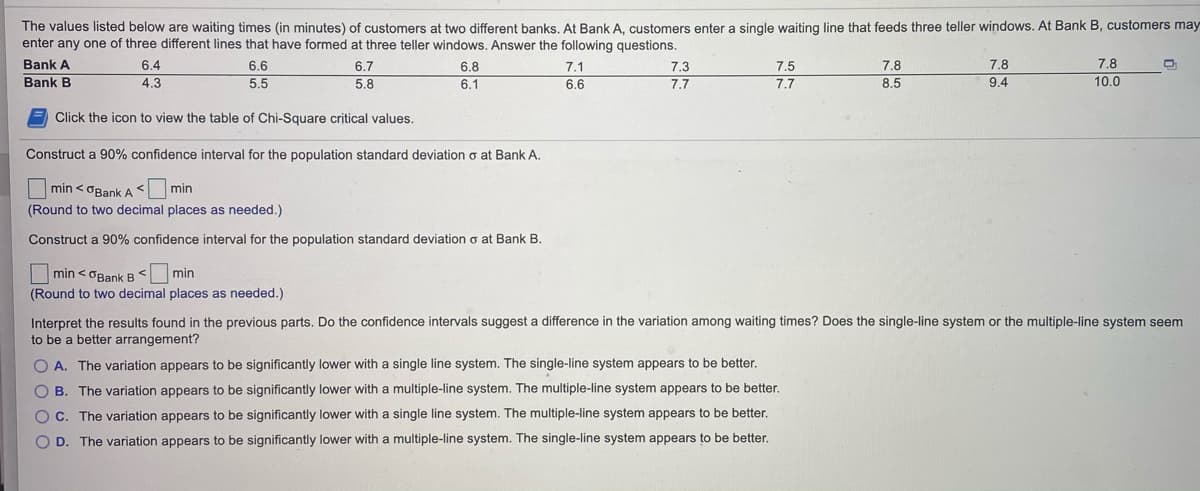
Transcribed Image Text:The values listed below are waiting times (in minutes) of customers at two different banks. At Bank A, customers enter a single waiting line that feeds three teller windows. At Bank B, customers may
enter any one of three different lines that have formed at three teller windows. Answer the following questions.
Bank A
6.4
6.6
6.7
6.8
7.1
7.3
7.5
7.8
7.8
7.8
Bank B
4.3
5.5
5.8
6.1
6.6
7.7
7.7
8.5
9.4
10.0
E Click the icon to view the table of Chi-Square critical values.
Construct a 90% confidence interval for the population standard deviation o at Bank A.
O min < OBankA min
(Round to two decimal places as needed.)
Construct a 90% confidence interval for the population standard deviation o at Bank B.
min < OBank B< min
(Round to two decimal places as needed.)
Interpret the results found in the previous parts. Do the confidence intervals suggest a difference in the variation among waiting times? Does the single-line system or the multiple-line system seem
to be a better arrangement?
O A. The variation appears to be significantly lower with a single line system. The single-line system appears to be better.
O B. The variation appears to be significantly lower with a multiple-line system. The multiple-line system appears to be better.
OC. The variation appears to be significantly lower with a single line system. The multiple-line system appears to be better.
O D. The variation appears to be significantly lower with a multiple-line system. The single-line system appears to be better.
Expert Solution
This question has been solved!
Explore an expertly crafted, step-by-step solution for a thorough understanding of key concepts.

Step by step
Solved in 3 steps with 10 images

Knowledge Booster


Learn more about
Need a deep-dive on the concept behind this application? Look no further. Learn more about this topic, statistics and related others by exploring similar questions and additional content below.Recommended textbooks for you
Glencoe Algebra 1, Student Edition, 9780079039897…
Algebra
ISBN:
9780079039897
Author:
Carter
Publisher:
McGraw Hill

Big Ideas Math A Bridge To Success Algebra 1: Stu…
Algebra
ISBN:
9781680331141
Author:
HOUGHTON MIFFLIN HARCOURT
Publisher:
Houghton Mifflin Harcourt
Glencoe Algebra 1, Student Edition, 9780079039897…
Algebra
ISBN:
9780079039897
Author:
Carter
Publisher:
McGraw Hill
Big Ideas Math A Bridge To Success Algebra 1: Stu…
Algebra
ISBN:
9781680331141
Author:
HOUGHTON MIFFLIN HARCOURT
Publisher:
Houghton Mifflin Harcourt