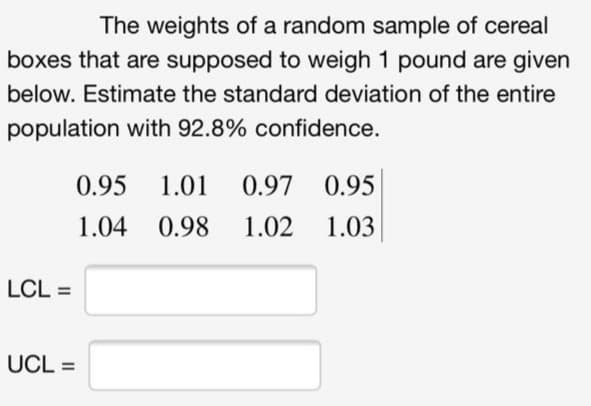
The weights of a random sample of cereal boxes that are supposed to weigh 1 pound are given below. Estimate the standard deviation of the entire population with 92.8% confidence. 0.95 1.01 0.97 0.95 1.04 0.98 1.02 1.03


Q: An industrial process that makes 3-foot sections of plasticpipe produces pipe with an average inside…
A: A z score is an important metric in statistics which helps us to know whether the given data is…
Q: ng methods for PVT analysis and possible uncertainties faced during the sampling. Propose the…
A: Different types of sampling methods for PVT analysis
Q: Using the standard normal probabilities Z-Table, what are the Z-scores for the following confidence…
A: A standard normal table, also called the unit normal table or Z table, may be a mathematical table…
Q: The data show the bug chirps per minute at different temperatures. Find the regression equation,…
A:
Q: A company is researching the effectiveness of a new website design to decrease the time to access a…
A: Since the test is the data from the dependent two sample t test
Q: Each of these columns of data represent a different soda bottling line, with the values representing…
A: Given Information:
Q: What sample sizes are necessary at population sizes of 1 billion, 10,000, and 100 with a confidence…
A: Given- At 90% Confidence level-Z = 1.645Margin of Error (E) = 6% or 0.06
Q: Aspen Plastics produces plastic bottles to customer order. The quality inspector randomly selects…
A: Solution: We have to find the centre line of the 3-Sigma R chart. The formula for a centre line is…
Q: A simple random sample is a sample drawn in such a way that each member of the population has:…
A: Simple random sampling: It is a primary sampling method and can easily be a segment of a more…
Q: One survey showed that 59% of Internet users are somewhat concerned about the confidentiality of…
A: It is given that P(X) = 6 n= 10 p= 0.59
Q: The widths of 79 randomly selected window blinds were found to have a standard deviation of 2.37.…
A: It is given that standard deviation of 79 randomly selected blinds is 2.3. Now the 95% confidence…
Q: An airline operates a call center to handle customer questions and complaints. The airline monitors…
A:
Q: Using the given table compute for Mean Absolute Deviation (MAD). Using the given table compute for…
A: Forecasting is the process of prediction in which sales demand is estimated using historic…
Q: Which is best defined as “the critical difference a researcher wants to be able to detect”? 1.…
A: The test of statistic is a mathematical formula that allows researchers to find out the chances of…
Q: 4. C-Spec, Inc., is attempting to determine whether an existing machine is capable of milling an…
A: From the data, Mean = 4.001 inches Standard deviation = 0.002 inches Specification = 4±0.003 inches…
Q: a. What is a residual? b. In what sense is the regression line the straight line that "best" fits…
A:
Q: The tracking signal is the: mean absolute percent error (MAPE). cumulative error. standard error of…
A: Option 1: - Mean absolute percent error(MAPE) is the ratio of the difference between actual value…
Q: A random survey of 250 homeowners in a resort community in Florida reported that water damage was…
A: Determine the margin of error: p^=32250 =0.12832 q^=1-0.128 = 0.872
Q: All patients admitted to a particular hospital can be released on the same day or kept overnight for…
A: a) Total sample size = total number of patients =n=2550
Q: The tracking signal is the:a) standard error of the estimate.b) cumulative error.c) mean absolute…
A: Forecasting is the process of making assumptions of the future on the basis of past and present data…
Q: lagement Fall20 Random variation is also known as common cause variation. Select one: O a. FALSE O…
A: An organization consists of various processes taking place at a single point in time. Basic business…
Q: Discuss the basic differences between the mean absolute deviation and mean absolute percent error.
A: Mean absolute deviation The mean absolute deviation is determined by using the difference between…
Q: A Quality Analyst wants to construct a control chart for determining whether five machines, all…
A: Find the Given details below: Given details: Machine Measurement 1 2 3 4 M1 318 304 313…
Q: Using samples of 200 credit card statements, an auditor found the following:Sample 1 2 3 4Number…
A: Note: I have answered for parts (a), (b), and (c). Kindly post the remaining questions separately.…
Q: A Taguchi quality loss function (QLF)a. is used to define the tolerance range in the goalpost…
A: The quality loss function (QLF) disagrees with the traditional (goalpost) view. The quality loss…
Q: We draw a random sample of size 25 from a normal population with variance 1.9. If the sample mean…
A: ANSWER IS AS BELOW:
Q: (c) Based on what we know about Observation B, if the cutoff value is lowered to 0.2, what happens…
A:
Q: An operator wants to determine the standard deviation for a machine she operates. To do this, she…
A: Given,
Q: In a hypothesis test, a small value for the sample variance increases the likelihood that a…
A: This statement is false.
Q: What are the expected frequencies for the conditions below?
A: The expected frequencies are 19.25, 30.09, 15.64, 12.74, 19.90, and 10.35.
Q: Megasigma Corp. has a process they believe is operating near the six sigma level and want to verify…
A: Sigma Level is calculated using below formula
Q: In a random sample of 250 homeowners from a population of homeowners in a Florida resort community,…
A:
Q: A product must measure 10+0.88 cm. If the process has a standard deviation of 0.20 cm, what is the…
A:
Q: A car-rental company is interested in the amount of time its vehicles are out of operation for…
A: Given data: No. of Samples 1 2 3 4 5 6 7 8 9 10 Samples 16 13 23 26 18 15 20 14 12 7
Q: c) The mean absolute deviation based on a 2-day moving average = degrees (round your response to one…
A: Question has asked to answer only the part C. We have got the temperature data for last week, here,…
Q: The process capability index for the current process is ____. Round to three decimal places.
A: Upper Specification Limit (USL) = 200.2 mgLower Specification Limit (LSL) = 199.8 mgMean (μ) =…
Q: Elon Corporation manufactures parts for an aircraft company. It uses a computerized numerical…
A: Upper Specification Limit U = 1.275+0.024=1.299 Lower Specification Limit L =…
Q: Construct a p-chart that plots the percentage of patients unsatisfie with their mcals. Set the…
A: Below is the solution:-
Q: The accuracy of the point estimate is measured by its a. sampling error. b.…
A: The accuracy of the point estimate is measured by its standard error. The standard deviation of the…
Q: You want to determine the control lines for a "p" chart for quality control purposes. If the total…
A: Answer = 0.04841
Q: In an acceptance sampling plan developed for lotscontaining 1,000 units, the sample size n is 85.…
A: Every product in a production unit has to meet specific standards before it leaves the production…
Q: How large a sample should be selected to provide a 95% confidence interval with a margin of error of…
A: The confidence interval 95% refers to the value of the range that contains the population means. The…
Q: Based on a random sample of size 75, you observe a sample mean of 85.63 and a sample standard…
A: Given information:
Q: An automobile manufacturer claims that its van has a 37.437.4 miles/gallon (MPG) rating. An…
A: This question is related to the topic Production or Process Management using business statistics or…
Q: Elon Corporation manufactures parts for an aircraft company. It uses a computerized numerical…
A: Given data, Mean = 1.281 Lower specification limit (LSL) Upper specification limit (USL)…


Trending now
This is a popular solution!

Step by step
Solved in 2 steps with 2 images


- Use Excels functions (not @RISK) to generate 1000 random numbers from a normal distribution with mean 100 and standard deviation 10. Then freeze these random numbers. a. Calculate the mean and standard deviation of these random numbers. Are they approximately what you would expect? b. What fraction of these random numbers are within k standard deviations of the mean? Answer for k = 1; for k = 2; for k = 3. Are the answers close to what they should be (about 68% for k = 1, about 95% for k = 2, and over 99% for k = 3)? c. Create a histogram of the random numbers using about 10 bins of your choice. Does this histogram have approximately the shape you would expect?Federal Income Tax Returns. The Wall Street Journal reports that 33% of taxpayers with adjusted gross incomes between$30,000and$60,000 itemized deductions on their federal income tax return. The mean amount of deductions for this population of taxpayers was$16,642. Assume the standard deviation is σ=$2400. What is the probability that a sample of taxpayers from this in-come group who have itemized deductions will show a sample mean within$200 of the population mean for sample sizes 30?Based on a random sample of size 75, you observe a sample mean of 85.63 and a sample standard deviation of 19.71. Which of the following are the endpoints of a 90% confidence interval for the population mean? (Because of potential roundoff, choose the closest.) a. 82.69 to 88.57 b. 81.84 to 89.42 c. 79.61 to 91.65 d. 81.10 to 90.16
- The Empirical Rule tells us that … a) __________ of the data lies within 1 standard deviation of the mean b) __________ of the data lies within 2 standard deviation of the mean c) __________ of the data lies within 3 standard deviation of the meanIn a school district, all sixth grade students take the same standardized test. The superintendant of the school district takes a random sample of 26 scores from all of the students who took the test. She sees that the mean score is 184 with a standard deviation of 18.2982. The superintendant wants to know if the standard deviation has changed this year. Previously, the population standard deviation was 17. Is there evidence that the standard deviation of test scores has increased at the α=0.01 level? Assume the population is normally distributed. Step 1 of 5 : State the null and alternative hypotheses. Round to four decimal places when necessary.The general meaning of a standard error is best described by which of the following? a. A standard error is another term for the estimated standard deviation of the population. b. If you go out about two standard errors on either side of 0, you can be about 95% confident that the unknown population parameter will be in the resulting interval. c. A standard error is essentially a standard deviation, specifically, the standard deviation of the sampling distribution of the estimate of the population parameter. d. All of these choices are correct characterizations of a typical standard error.
- The population’s mean is 30 and the mean of a sample of size 100 is 28.5. The variance of the sample is 25. The standard error of the sample mean is closest to: 0.05. 0.25. 0.50.In a random sample of 250 homeowners from a population of homeowners in a Florida resort community, 32 report that they had water damage during the past rainy season. The endpoints of a 95% confidence interval for the proportion of all homeowners who had water damage are closest to which of the following? a. 0.081 to 0.175 b. 0.073 to 0.182 c. 0.093 to 0.163 d. 0.087 to 0.169Small Mean Problem. Grandfather clocks have a particular market in auctions. You are given a random sample of 25 purchases of grandfather clocks at auctions in Pennsylvania. The sample statistics are: Mean = $1,343.04 Std Dev = $414.04 C.V. = 30.83 N = 25 You are asked to create a 95% Confidence Interval around the price for this sample. What is the Lower Bound for this confidence interval? I just want the answer. Use 2 decimal places for your answer and use the proper rules of rounding.
- A random survey of 250 homeowners in a resort community in Florida reported that water damage was reported in the last rainy season. The 95 percent trust intervals for the percentage of all homeowners with water loss are nearest to what? The above are 0.081 to 0.175 b. 0.073 to 0.182 C. 0.093 to 0.163 to 0.169 d. 0.087An industrial process that makes 3-foot sections of plasticpipe produces pipe with an average inside diameter of 1 inch and a standard deviation of .05 inch.a. If you randomly select one piece of pipe, what is the probability that its inside diameter willexceed 1.02 inches, assuming the population is normal?b. If you select a random sample of 25 pieces of pipe, what is the probability that the sample meanwill exceed 1.02 inches?μ = 1.00, σ = .05Each of these columns of data represent a different soda bottling line, with the values representing the amount of soda per bottle in ounces. The business question being asked for each of the three comparisons is "do the two bottling lines bottle the same volume of soda on average, bearing in mind that the sample difference that you may observe could just be coincidence." What is the null hypotheses? Alternative hypothesis P value Alpha=0.05 Is it significant ? t-Test: Two-Sample Assuming Unequal Variances C7 C8 Mean 20.01679499870 20.59290905613 Variance 0.01032479977 0.01011215081 Observations 50.00000000000 50.00000000000 Hypothesized Mean Difference 0.00000000000 df 98.00000000000 t Stat 28.49610006164 P(T<=t) one-tail 0.00000000000 t Critical one-tail 1.66055121707 P(T<=t) two-tail 0.00000000000 t Critical two-tail 1.98446745451