The DuPont equation shows the relationships among asset management, debt management, and ratios. Management can use the DuPont equation to analyze ways of improving the firm's performance. Its equation is: Ratio analysis is important to understand and interpret financial statements; however, sound financial analysis involves more than just calculating and interpreting numbers. factors also need to be considered. Quantitative Problem: Rosnan Industries' 2022 and 2021 balance sheets and income statements are shown below. Balance Sheets 2022 2021 Assets Cash and equivalents $ 70 $ 55 Accounts receivable 275 300 Inventories 375 350 Total current assets $ 720 $ 705 Net plant and equipment 2,000 1,490 Total assets $ 2,720 $ 2,195 Liabilities and Equity Accounts payable $ 150 $ 85 Accruals 75 50 Notes payable 120 145 Total current liabilities $ 345 $ 280 Long-term debt 450 290 Total liabilities $ 795 $ 570 Common stock 1,225 1,225 Retained earnings 700 400 Total common equity $ 1,925 $ 1,625 Total liabilities and equity $ 2,720 $ 2,195 Income Statements 2022 2021 Sales $ 2,000 $ 1,500 Operating costs excluding depreciation and amortization 1,350 1,050 EBITDA $ 650 $ 450 Depreciation and amortization 116 101 EBIT $ 534 $ 349 Interest 62 45 EBT $ 472 $ 304 Taxes (25%) 118 76 Net income $ 354 $ 228 Dividends paid $54 $48 Addition to retained earnings $300 $180 Shares outstanding 100 100 Price $25.00 $22.50 WACC 10.00% What is the firm's 2022 current ratio? Do not round intermediate calculations. Round your answer to two decimal places. If the industry average debt-to-assets ratio is 30%, then Rosnan's creditors have a cushion than indicated by the industry average. What is the firm's 2022 net profit margin? Do not round intermediate calculations. Round your answer to two decimal places. % If the industry average profit margin is 12%, then Rosnan's lower than average debt-to-assets ratio might be one reason for its high profit margin. What is the firm's 2022 price/earnings ratio? Do not round intermediate calculations. Round your answer to two decimal places. Using the DuPont equation, what is the firm's 2022 ROE? Do not round intermediate calculations. Round your answer to two decimal places.


The DuPont equation shows the relationships among asset management, debt management, and ratios. Management can use the DuPont equation to analyze ways of improving the firm's performance. Its equation is:
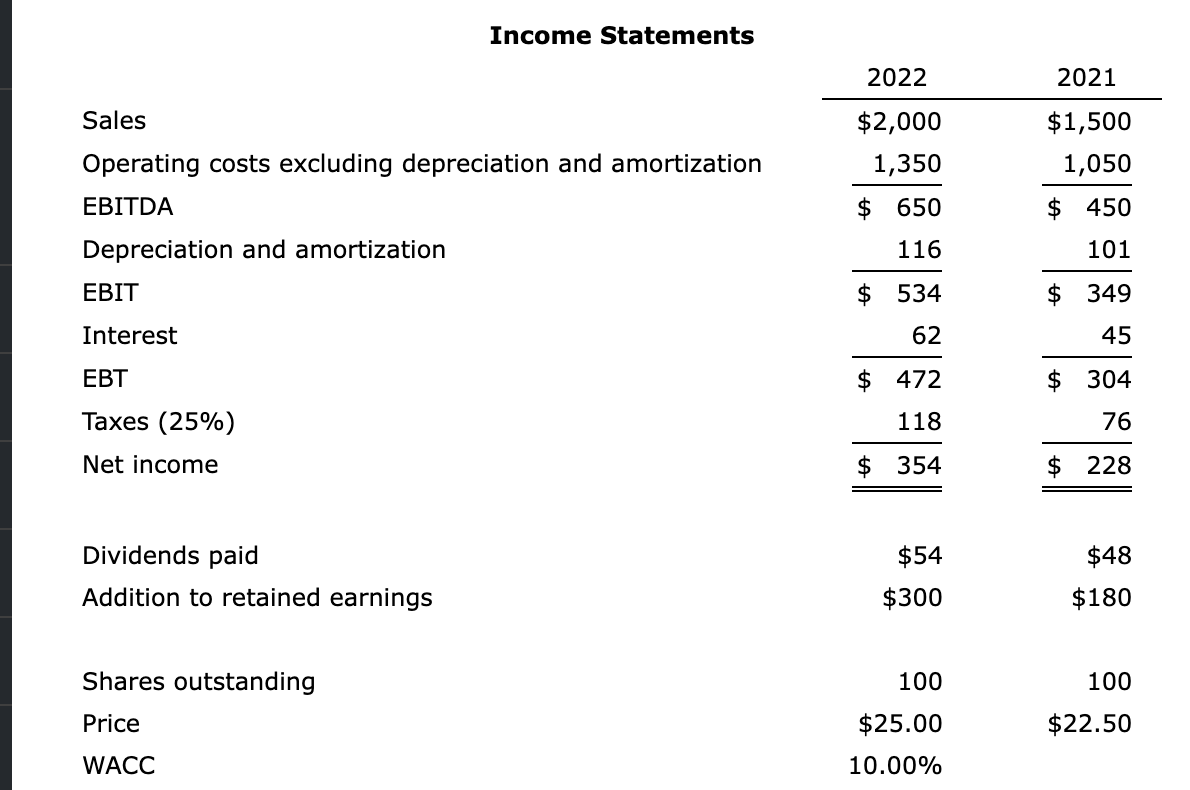
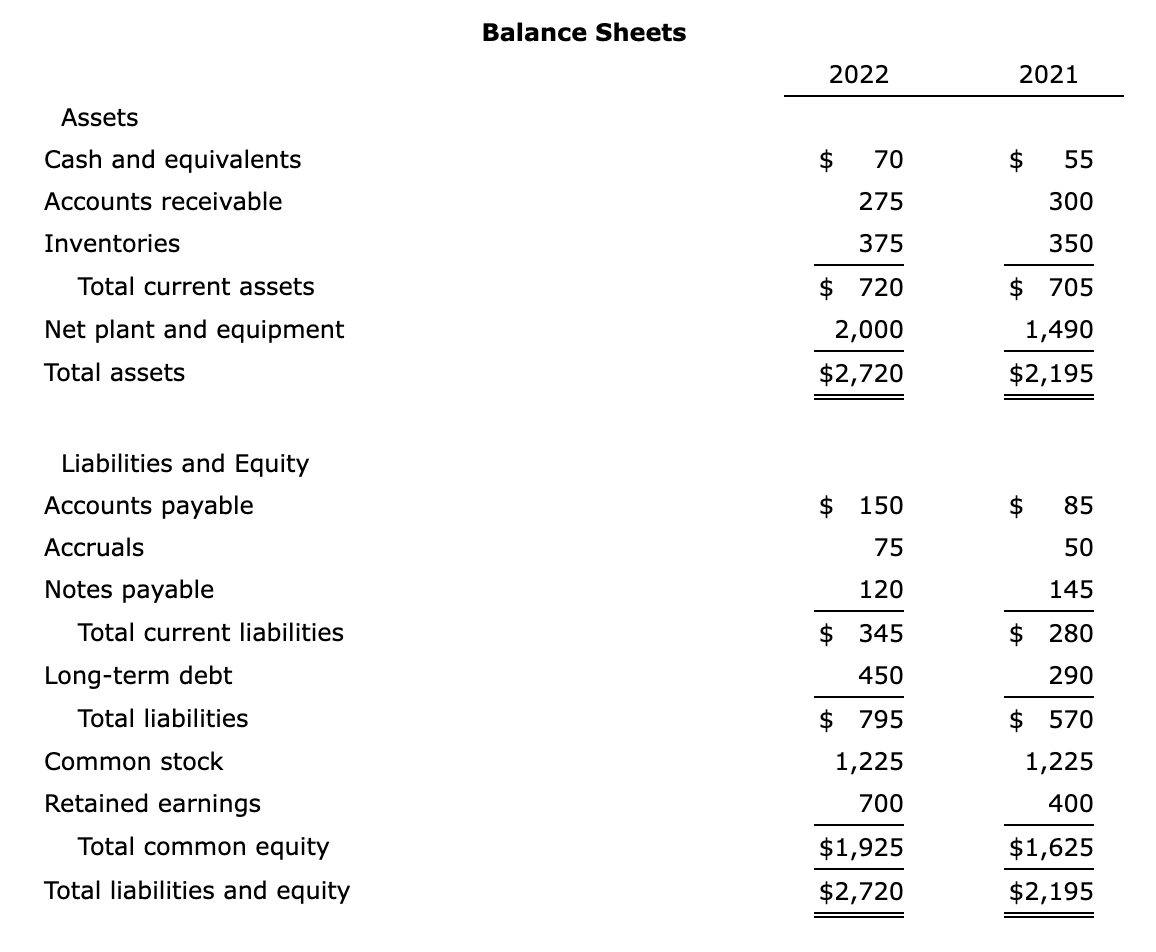
Quantitative Problem: Rosnan Industries' 2022 and 2021 balance sheets and income statements are shown below.
| Balance Sheets | |||||||||
| 2022 | 2021 | ||||||||
| Assets | |||||||||
| Cash and equivalents | $ | 70 | $ | 55 | |||||
| 275 | 300 | ||||||||
| Inventories | 375 | 350 | |||||||
| Total current assets | $ | 720 | $ | 705 | |||||
| Net plant and equipment | 2,000 | 1,490 | |||||||
| Total assets | $ | 2,720 | $ | 2,195 | |||||
| Liabilities and Equity | |||||||||
| Accounts payable | $ | 150 | $ | 85 | |||||
| Accruals | 75 | 50 | |||||||
| Notes payable | 120 | 145 | |||||||
| Total current liabilities | $ | 345 | $ | 280 | |||||
| Long-term debt | 450 | 290 | |||||||
| Total liabilities | $ | 795 | $ | 570 | |||||
| Common stock | 1,225 | 1,225 | |||||||
| 700 | 400 | ||||||||
| Total common equity | $ | 1,925 | $ | 1,625 | |||||
| Total liabilities and equity | $ | 2,720 | $ | 2,195 |
| Income Statements | |||||||||
| 2022 | 2021 | ||||||||
| Sales | $ | 2,000 | $ | 1,500 | |||||
| Operating costs excluding |
1,350 | 1,050 | |||||||
| EBITDA | $ | 650 | $ | 450 | |||||
| Depreciation and amortization | 116 | 101 | |||||||
| EBIT | $ | 534 | $ | 349 | |||||
| Interest | 62 | 45 | |||||||
| EBT | $ | 472 | $ | 304 | |||||
| Taxes (25%) | 118 | 76 | |||||||
| Net income | $ | 354 | $ | 228 | |||||
| Dividends paid | $54 | $48 | |||||||
| Addition to retained earnings | $300 | $180 | |||||||
| Shares outstanding | 100 | 100 | |||||||
| Price | $25.00 | $22.50 | |||||||
| WACC | 10.00% |
What is the firm's 2022
If the industry average debt-to-assets ratio is 30%, then Rosnan's creditors have a cushion than indicated by the industry average.
What is the firm's 2022 net profit margin? Do not round intermediate calculations. Round your answer to two decimal places.
%
If the industry average profit margin is 12%, then Rosnan's lower than average debt-to-assets ratio might be one reason for its high profit margin.
What is the firm's 2022 price/earnings ratio? Do not round intermediate calculations. Round your answer to two decimal places.
Using the DuPont equation, what is the firm's 2022 ROE? Do not round intermediate calculations. Round your answer to two decimal places.


Trending now
This is a popular solution!

Step by step
Solved in 5 steps


