There are four McBurger restaurants in the Columbus, Georgia, area. The numbers of burgers sold at the respective restaurants for each of the last 6 weeks are shown below. Is there a difference in the mean number sold among the four restaurants when the factor of the week is considered? Restaurant Week Metro Interstate University River 1 124 160 320 190 2 234 220 340 230 3 430 290 290 240 4 105 245 310 170 5 240 205 280 180 6 310 260 270 205 b. What are the test statistics? Treatments: Blocks: C. What are the p-values? Treatments: Blocks:
There are four McBurger restaurants in the Columbus, Georgia, area. The numbers of burgers sold at the respective restaurants for each of the last 6 weeks are shown below. Is there a difference in the mean number sold among the four restaurants when the factor of the week is considered? Restaurant Week Metro Interstate University River 1 124 160 320 190 2 234 220 340 230 3 430 290 290 240 4 105 245 310 170 5 240 205 280 180 6 310 260 270 205 b. What are the test statistics? Treatments: Blocks: C. What are the p-values? Treatments: Blocks:

Chapter5: Decimals
Section5.5: Averages And Probability
Problem 400E: The cash register receipts each day last week at a coffee shop were $1,845. $1,520. $1,438, $1,682,...

Related questions
Question
100%
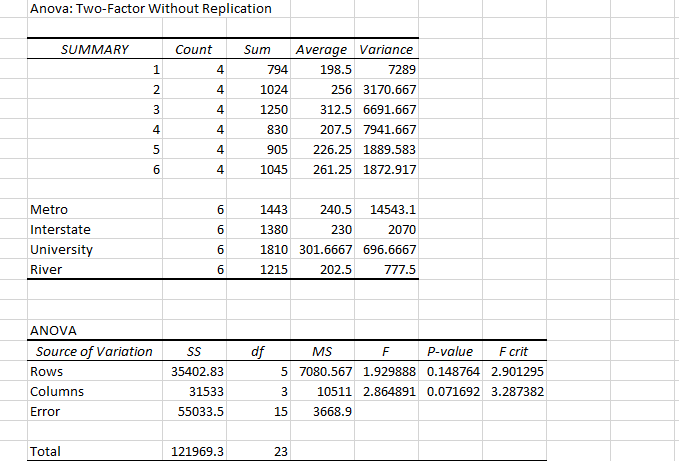
There are four McBurger restaurants in the Columbus, Georgia, area. The numbers of burgers sold at the respective restaurants for each of the last 6 weeks are shown below. Is there a difference in the mean number sold among the four restaurants when the factor of the week is considered?
| Restaurant | ||||
| Week | Metro | Interstate | University | River |
| 1 | 124 | 160 | 320 | 190 |
| 2 | 234 | 220 | 340 | 230 |
| 3 | 430 | 290 | 290 | 240 |
| 4 | 105 | 245 | 310 | 170 |
| 5 | 240 | 205 | 280 | 180 |
| 6 | 310 | 260 | 270 | 205 |
b. What are the test statistics?
Treatments:
Blocks:
C. What are the p-values?
Treatments:
Blocks:
Expert Solution
Step 1
Step-by-step procedure to obtain the ANOVA data using Excel is given below:
- In Excel sheet, enter Weeks and Restaurants in one column.
- In Data, select Data Analysis and choose ANOVA- Two-Factor Without Replication.
- In Input Variable Range, select Weeks and Restaurants.
- Click Labels.
- Click Ok.
Output using the Excel is given below:

Trending now
This is a popular solution!

Step by step
Solved in 2 steps with 1 images

Knowledge Booster


Learn more about
Need a deep-dive on the concept behind this application? Look no further. Learn more about this topic, statistics and related others by exploring similar questions and additional content below.Recommended textbooks for you

Glencoe Algebra 1, Student Edition, 9780079039897…
Algebra
ISBN:
9780079039897
Author:
Carter
Publisher:
McGraw Hill
Glencoe Algebra 1, Student Edition, 9780079039897…
Algebra
ISBN:
9780079039897
Author:
Carter
Publisher:
McGraw Hill