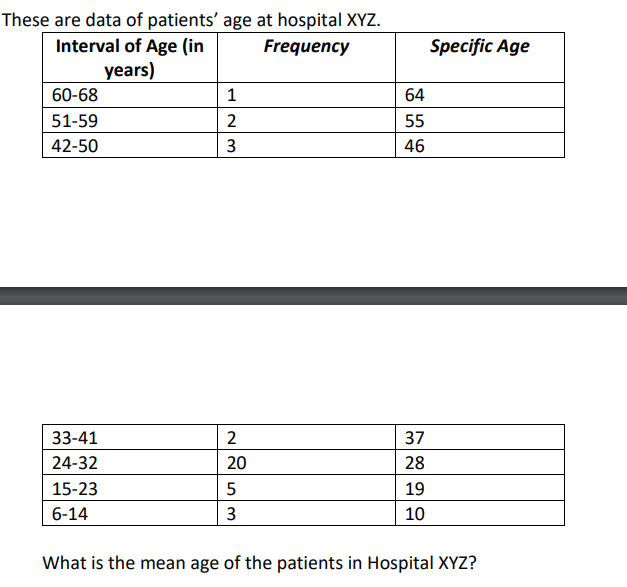
These are data of patients' age at hospital XYZ. Interval of Age (in Frequency years) 60-68 51-59 42-50 33-41 24-32 15-23 6-14 1 23 ~18 2 20 5 3 64 55 46 37 28 19 10 Specific Age What is the mean age of the patients in Hospital XYZ?


Q: Polyunsaturated fatty acids in the diet favorably affect several risk factors for cardiovascular…
A: Cardiovascular disease is a leading cause of death worldwide, and risk factors for this disease…
Q: These two histograms show the number of text messages sent in one week by two groups of 100…
A: From given
Q: A single strand of a DNA molecule is a sequence of nucleotides. There are four possible nucleotides…
A: Note: As an expert from Bartleby, According to their honor code, we should solve only 3…
Q: 1. A garlic press factory has four machines turning out garlic presses. Machine 1 makes 35% of the…
A: Given that, The event M1 is the press came from machine 1 The event M2 is the press came from…
Q: Assume that z-scores are normally distributed with a mean of 0 and a standard deviation of 1. If…
A: Given,P(-b<Z<b)=0.1904
Q: Suppose the null hypothesis is rejected and the true mean is 17 units. What type of error, if any,…
A: Let μ= average demand per month. Given that, Population mean (μ) = 34 units The hypothesis for the…
Q: About ______% of the area under the curve of the standard normal distribution is between z=−1.904…
A: The question is about std. normal distribution Introduction : 1 ) z is a std. normal r.v which…
Q: Prop XYZ is coming up on the ballot. A polling agency takes a random sample and finds that the 52%…
A: Suppose p is the population proportion of voters that will support the ballot.
Q: In a recent poll six hundred adults were asked a series of questions about the state of the economy…
A: Note: Hi! Thank you for posting the question. Since you have posted multiple questions, we are…
Q: A particular fruit's weights are normally distributed, with a mean of 450 grams and a standard…
A: Given,mean(μ)=450standard deviation(σ)=12
Q: 13. Examine the following regression equation and answer the questions that follow: Salary = 261,128…
A: The regression equation of the salary of Players is Salary=261128+91569 Goals+16346 Assists-585560…
Q: For a 95% confidence interval, what value will you use for t*? Group of answer choices 1.960 2.030…
A: There are two types of houses, houses with a view of a nearby lake and houses with no view of the…
Q: The requirements for performing a one-sample t-test been met for the following reasons. The sample…
A: The objective is o define if the considered one-sample t-test is desired for testing the set-up…
Q: 9. Find correlation coefficient between x and z in question 7. -0.99 -0.95 0 0.95 0.99
A: We have given data set, X Z 1 1.40 2 3.78 3 4.41 4 4.60 5 8.40 6 8.64 7 12.81
Q: 1. On average daang hari experiences a car accident per day. What is the probability that daang hari…
A: given data λ = 1 car accident per dayx = no. of car accidents in t daysx follows poisson…
Q: Consider the following regression Yi = βXi + ui. Show that (a) the OLS estimator of β is βˆ =…
A: Given that Consider the following regression Yi = βXi + ui. Show that (a) the OLS estimator of β is…
Q: A large corporation sends many of its first-level managers to an off-site supervisory skills…
A:
Q: of 30 provided 22 observations greater than 190, 3 observations equ value of the test statistic.…
A: Given Total sample size =27 Mean =np=13.5
Q: Question # 18 Calculate the Population Standard Deviation for the following Data Set: X= 5, 7, 12,…
A: We have given data set, X=5, 7, 12, 5, 9, 4, 6, 4, 12, 5, 7, 9
Q: Develop a model to test the hypothesis that location is the most important factor in determing the…
A: The following steps would be taken in order to create an econometric model to examine the claim that…
Q: Find the area of the shaded region. The graph depicts the standard normal distribution of bone…
A: Given data : P ( -0.82 < z < 1.25) = ?
Q: You hear on the local news that for the city of Kalamazoo, the proportion of people who support…
A: According to the given information in this question We need to identify the correct option
Q: (a) Erythromycin is a drug that has been proposed to possibly lower the risk of premature delivery.…
A: Answer Given that: p=30% =30/100 = 0.30 X =64 n =175 proportion =x/n =64/175 ~0.3657 right tailed…
Q: Suppose your manager indicates that for a normally distributed data set you are analyzing, your…
A: The question asked about calculating the percentage of data points that fall within a specified…
Q: IS ale h measurement
A:
Q: An SRS of 400 high school seniors gained an average of x = 40 points in their second attempt at the…
A: given data N = 400x¯ = 40normal distributionσ = 25sample size (n) = 100
Q: For a standard normal distribution, find: P(-0.41 < z < -0.13)
A: Given,P(-0.41<Z<-0.13)
Q: A genetic experiment with peas resulted in one sample of offspring that consisted of 447 green peas…
A: a. Suppose p is the population proportion of yellow peas.
Q: Based on least squared regression method find the projections for the years 2021, 2022, and 2023.…
A: Note: Since the values of forecasts Ft and FITt are missing for initial period t=2012, we cannot…
Q: Consider the population of all 1-gallon cans of dusty rose paint manufactured by a particular paint…
A: Answer Given Mean =6 standard deviation =0.2 We know that z-score: Z =[x-mu]/sigma using formula…
Q: Test the claim that the proportion of people that have some type of mental health issue is greater…
A: Suppose p is the true proportion of people who have some type of mental issue.
Q: Assume that the readings at freezing on a batch of thermometers are normally distributed with a mean…
A: Answer:- Given, The readings at freezing on a batch of thermometers are normally distributed with a…
Q: 8. Find z intercept of a linear regression model from question 7. -1.7 -0.5 0 0.5 1.7 CS Scanned…
A: The z intercept of the linear regression model is
Q: The graph represents a continuous probability distribution. Use the graph to answer the questions.…
A: Given information: A graph of the continuous probability distribution is given.
Q: (b)Write the equation that gives the z score corresponding to a Stanford-Binet IQ test score. 100)/…
A: Let X = IQ test scores. Given that, X ~ N(mean = 100, sd = 11) The formula for Z-score is.…
Q: Storage of Soil Samples. The concentration of benzene (ug/g) in soil was measured after being stored…
A: Given data: Sample size Sample mean Sample standard deviation Day 0 3 6.1 0.7 Day 5 3 5.9…
Q: In this exercise involving paired differences, consider that it is reasonable to assume the…
A: Given: The data for the percent on-time arrival for flights in 2006 and 2007 from 11 different…
Q: A normal distribution is informally described as a probability distribution that is "bell-shaped"…
A: GivenA normal distribution is informally described as a probability distribution that is…
Q: In a study of 465 women, researchers wanted to evaluate if education level was related to the stage…
A: Given data:
Q: Suppose the national average dollar amount for an automobile insurance claim is $973.04. You work…
A: It is given that, the national average amount for an automobile insurance claim is $973.04
Q: A weighted dice satisfies the following probability distribution: p(1) = p(5), 4.p(3) = p(2), and…
A: To solve this problem, we first need to determine the probability of rolling each number on the…
Q: (Depreciation). Table 2 gives the market value of a luxury sedan (in dollars) x years after its…
A:
Q: Find the area of the shaded region. The graph depicts the standard normal distribution of bone…
A: The given mean is 0 and standard deviation is 1. The shaded region is z=-0.99 to z=1.28.
Q: This question is intended to assess your use of relative frequencies and Bayes theorem, and your use…
A: Given that, Test A is a relatively cheap but unreliable test for trying to detect oil. Let A = Test…
Q: The rise of online streaming services such as Netflix and HBO Go has dramatically altered the medial…
A: Given: A side-by-side frequency bar graph is given. Thus we have it in tabulated form as follows:…
Q: 6. Mrs. Dante collects data on the entry fees to local zoos for a class field trip. All of the entry…
A: Mrs. Dante needs to use measures of central tendency and variability that are suitable for…
Q: STATS LAB 7: Central Limit Theorem (Cookie Recipes) Given X= length of time (in days) that a cookie…
A: The given data is as follows, X 1 5 2 5 6 1 2 6 5 2 5 1 1 3 2 2…
Q: Assume that females have pulse rates that are normally distributed with a mean of μ=75.0 beats per…
A: Given,mean(μ)=75.0standard deviation(σ)=12.5sample size(n)=4
Q: 1. In a study of 465 women, researchers wanted to evaluate if education level was related to the…
A: Given data: Stage of cancer Education I II III IV TOTAL 6 years 19 24 33 41 117…
Q: Determine if the following data is approximately normal using the Pearson coefficient of skewness..…
A: The given data is as follows, 20 27 74 81 31 44 95 25 20 79 The formula for…
Statistics:
Given: Image below
Note: Show your solution

Step by step
Solved in 2 steps with 1 images

- Find the area of the shaded region. The graph to the right depicts IQ scores of adults, and those scores are normally distributed with a mean of 100 and a standard deviation of 15. A graph with a bell-shaped curve, divided into 3 regions by 2 lines from top to bottom, one on the left side and one on the right side. The region between the lines is shaded. Moving from left to right, the x-axis below the first line is labeled 75. The x-axis below the second line is labeled 110.Vehicle breakdowns are equally likely to occur at any point on a 10 kilometer stretch of a given expressway. An emergency recovery truck is stationed at one end of this stretch of expressway. Assume that the recovery truck travels at a constant speed of 50 kilometers/hour. What is the expected (average) time taken for the recovery truck to reach a vehicle that breaks down on this stretch of expressway?Scores on a certain IQ test are approximately normally distributed with a mean of 100 and astandard deviation of 20 for a certain population of school children. For purposes of thisexercise, treat this distribution as continuous. Find the proportion of the population having ascore(a) less than 130,(b) between 110 and 130,(c) between 80 and 110,(d) less than 61 or greater than 139,(e) greater than 133.(f) Find the score which is the 90th percentile of this IQ distribution, that is, the score thathas 90% of the population below it.
- The graph illustrates the distribution of test scores taken by College Algebra students. The maximum possible score on the test was 120, while the mean score was 72 and the standard deviation was 11. 395061728394105Distribution of Test Scores Use the "Empirical Rule", not a calculator or other technology. Do not round your answers. What is the approximate percentage of students who scored between 50 and 94 on the test?%What is the approximate percentage of students who scored between 61 and 72?%What is the approximate percentage students who scored between 61 and 83 on the test?%What is the approximate percentage of students who scored higher than 94 on the test?How likely it is that a mean from a particular sample is representative of the population is defined as: t-score F-statistic z-score p-valueFind the indicated IQ score. The graph to the right depicts IQ scores of adults, and those scores are normally distributed with a mean of 100 and a standard deviation of 15. x 0.9 A graph with a bell-shaped curve, divided into 2 regions by a line from top to bottom, on the right side. The region left of the line is shaded and labeled 0.9. The x-axis below the line is labeled "x". The indicated IQ score, x, is(Round to one decimal place as needed.)
- Assume that a car drove for two hours and traversed 120 miles. The average rate of change is clearly 60 miles per hour. Was it possible for the car to have gone over 60 mph at some point in the interval? Explain how. Was it possible for the car to have stayed under 60 mph the whole time? Explain how. Was it possible for the car never to have gone exactly 60 mph?Explain how. The truth of this statement is an example of the Mean Value Theorem from CalculusReducing the frequency from the tails of a distribution will: increase the standard deviation. reduce the standard deviation. not affect the standard deviation. depend of the N. depend on the range.The control department of a light bulb manufacturer randomly picks 4400 light bulbs from the production lot every week. The records show that, when there is no malfunction, the defect rate in the manufacturing process (due to imperfections in the material used) is 1% . When 1.25% or more of the light bulbs in the sample of 4400 are defective, the control unit calls repair technicians for service. Answer the following. (If necessary, consult a list of formulas.) (a)Find the mean of p, where pis the proportion of defective light bulbs in a sample of 4400when there is no malfunction. (b)Find the standard deviation of p . (c)Compute an approximation for P≥p0.0125 , which is the probability that the service technicians will be called even though the system is functioning properly. Round your answer to four decimal places.
- The fuel consumption, in miles per gallon, of all cars of a particular model has a population mean of 25 mpg and population standard deviation of 2 mpg. The population distribution can be assumed to be normal. Find the probability that a car, chosen at random, will have a fuel consumption of less than 24 mpg. Sketch the graph, label the area corresponding to the probability, write the probability in symbolic form before finding the probability (round to 4 decimal places)The control department of a light bulb manufacturer randomly picks 4400 light bulbs from the production lot every week. The records show that, when there is no malfunction, the defect rate in the manufacturing process (due to imperfections in the material used) is 1%. When 1.25% or more of the light bulbs in the sample of 4400 are defective, the control unit calls repair technicians for service. Answer the following. (If necessary, consult a list of formulas.) (a)Find the mean of p, where p is the proportion of defective light bulbs in a sample of 4400 when there is no malfunction. (b)Find the standard deviation of p. (c)Compute an approximation for P≥p0.0125, which is the probability that the service technicians will be called even though the system is functioning properly. Round your answer to four decimal places.How do you graph grade curves in StatCruch (finding two bounds within grades; ex. D, C, B)??? In other words, finding two cut off scores? Reference: The mean and standard deviation of last semester’s Test 1 scores are 76.5 and 14.8 respectively. Imagine we want to define letter grades using a Normal distribution (assuming this is appropriate). One possible grade distribution could be that the lowest 10% of students earn F’s, the next 15% earn D’s, the next 50% earn C’s, the next 15% earn B’s, and the rest of the students earn A’s. Using the Normal distribution, calculate the Test 1 scores that would separate these letter grades. Your answer needs to include five Normal graphs from StatCrunch where the shaded area on each graph shows the range of scores needed to earn the specific letter grade. Hint: The graphs for A and F will only have one value as a cutoff score whereas the graphs for a B, C, and D will have two cutoff scores. Which students are happy about their curved grades? Why?…

