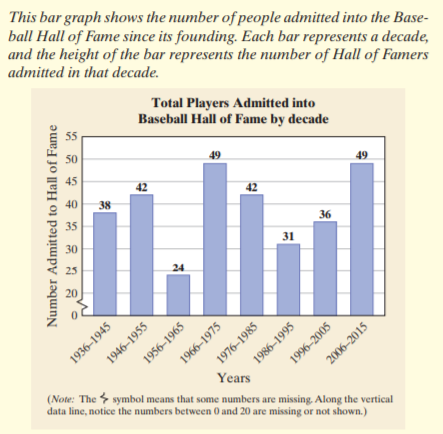
This bar graph shows the number of people admitted into the Base- ball Hall of Fame since its founding. Each bar represents a decade, and the height of the bar represents the number of Hall of Famers admitted in that decade. Total Players Admitted into Baseball Hall of Fame by decade 55 50 49 45 49 42 40 38 42 35 30 36 31 25 24 20 1936-1945 1946–1955 1976–1985 1996–2005 2006–2015 Years (Note: The symbol means that some numbers are missing. Along the vertical data line, notice the numbers between 0 and 20 are missing or not shown.) Number Admitted to Hall of Fame 1956–1965 1966–1975 1986-1995


Inverse Normal Distribution
The method used for finding the corresponding z-critical value in a normal distribution using the known probability is said to be an inverse normal distribution. The inverse normal distribution is a continuous probability distribution with a family of two parameters.
Mean, Median, Mode
It is a descriptive summary of a data set. It can be defined by using some of the measures. The central tendencies do not provide information regarding individual data from the dataset. However, they give a summary of the data set. The central tendency or measure of central tendency is a central or typical value for a probability distribution.
Z-Scores
A z-score is a unit of measurement used in statistics to describe the position of a raw score in terms of its distance from the mean, measured with reference to standard deviation from the mean. Z-scores are useful in statistics because they allow comparison between two scores that belong to different normal distributions.
In which decade(s) was the number of players admitted greater than 40?


Trending now
This is a popular solution!

Step by step
Solved in 2 steps with 2 images


