This exercise requires the use of a graphing calculator or computer programmed to do numerical integration. The normal distribution curve, which models the distributions of data in a wide range of app the function 1. P(x) = where = 3.14159265. and o and u are constants called the standard deviation and the mean, respectively. Its graph (for o = 1 and u = 2) is shown in the figure. 0.3 02 0.1 -1 I 2 3 45 With a = 3 and µ = 0, approximate p(x) dx. (Round your answer to four decimal places.)
This exercise requires the use of a graphing calculator or computer programmed to do numerical integration. The normal distribution curve, which models the distributions of data in a wide range of app the function 1. P(x) = where = 3.14159265. and o and u are constants called the standard deviation and the mean, respectively. Its graph (for o = 1 and u = 2) is shown in the figure. 0.3 02 0.1 -1 I 2 3 45 With a = 3 and µ = 0, approximate p(x) dx. (Round your answer to four decimal places.)

Glencoe Algebra 1, Student Edition, 9780079039897, 0079039898, 2018
18th Edition
ISBN:9780079039897
Author:Carter
Publisher:Carter
Chapter10: Statistics
Section10.1: Measures Of Center
Problem 9PPS

Related questions
Question
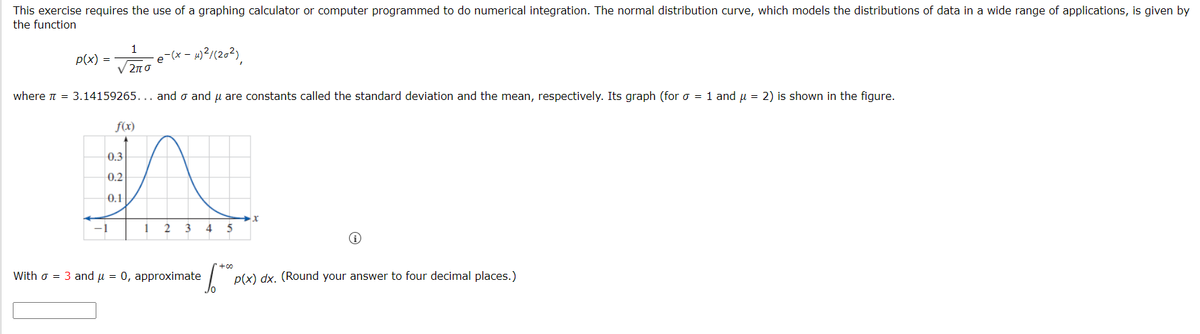
Transcribed Image Text:This exercise requires the use of a graphing calculator or computer programmed to do numerical integration. The normal distribution curve, which models the distributions of data in a wide range of applications, is given by
the function
1
p(x) =
e (x - 1)?/(202),
V 2n 0
where n = 3.14159265... and o and u are constants called the standard deviation and the mean, respectively. Its graph (for o = 1 and u = 2) is shown in the figure.
f(x)
0.3
0.2
0.1
3
4
5
With o = 3 and u = 0, approximate
p(x) dx. (Round your answer to four decimal places.)
Expert Solution
This question has been solved!
Explore an expertly crafted, step-by-step solution for a thorough understanding of key concepts.

This is a popular solution!

Trending now
This is a popular solution!

Step by step
Solved in 2 steps

Recommended textbooks for you
Glencoe Algebra 1, Student Edition, 9780079039897…
Algebra
ISBN:
9780079039897
Author:
Carter
Publisher:
McGraw Hill
Glencoe Algebra 1, Student Edition, 9780079039897…
Algebra
ISBN:
9780079039897
Author:
Carter
Publisher:
McGraw Hill