This graph shows how the wind resistance of a moving car increases with speed. 100 90 80 70 60 50 40 30 20 10 10 20 30 40 sO 60 70 80 90 100110120 Sneed km/h) An engineer uses the line of best fit for this graph to predict that at 100 km/h, the wind resistance will be 56 N. What is wrong with this prediction? The data show a non-linear pattern, so linear extrapolation will lead to an a) error. The line of best fit has been drawn incorrectly; there is an uneven number of O b) data points on either side. O C) There is nothing wrong with this prediction. O d) The engineer has made an error in reading the graph. Wind resistance (N)
This graph shows how the wind resistance of a moving car increases with speed. 100 90 80 70 60 50 40 30 20 10 10 20 30 40 sO 60 70 80 90 100110120 Sneed km/h) An engineer uses the line of best fit for this graph to predict that at 100 km/h, the wind resistance will be 56 N. What is wrong with this prediction? The data show a non-linear pattern, so linear extrapolation will lead to an a) error. The line of best fit has been drawn incorrectly; there is an uneven number of O b) data points on either side. O C) There is nothing wrong with this prediction. O d) The engineer has made an error in reading the graph. Wind resistance (N)

Algebra: Structure And Method, Book 1
(REV)00th Edition
ISBN:9780395977224
Author:Richard G. Brown, Mary P. Dolciani, Robert H. Sorgenfrey, William L. Cole
Publisher:Richard G. Brown, Mary P. Dolciani, Robert H. Sorgenfrey, William L. Cole
Chapter8: Introduction To Functions
Section8.6: Functions Defined By Tables And Graphs
Problem 10WE

Related questions
Question
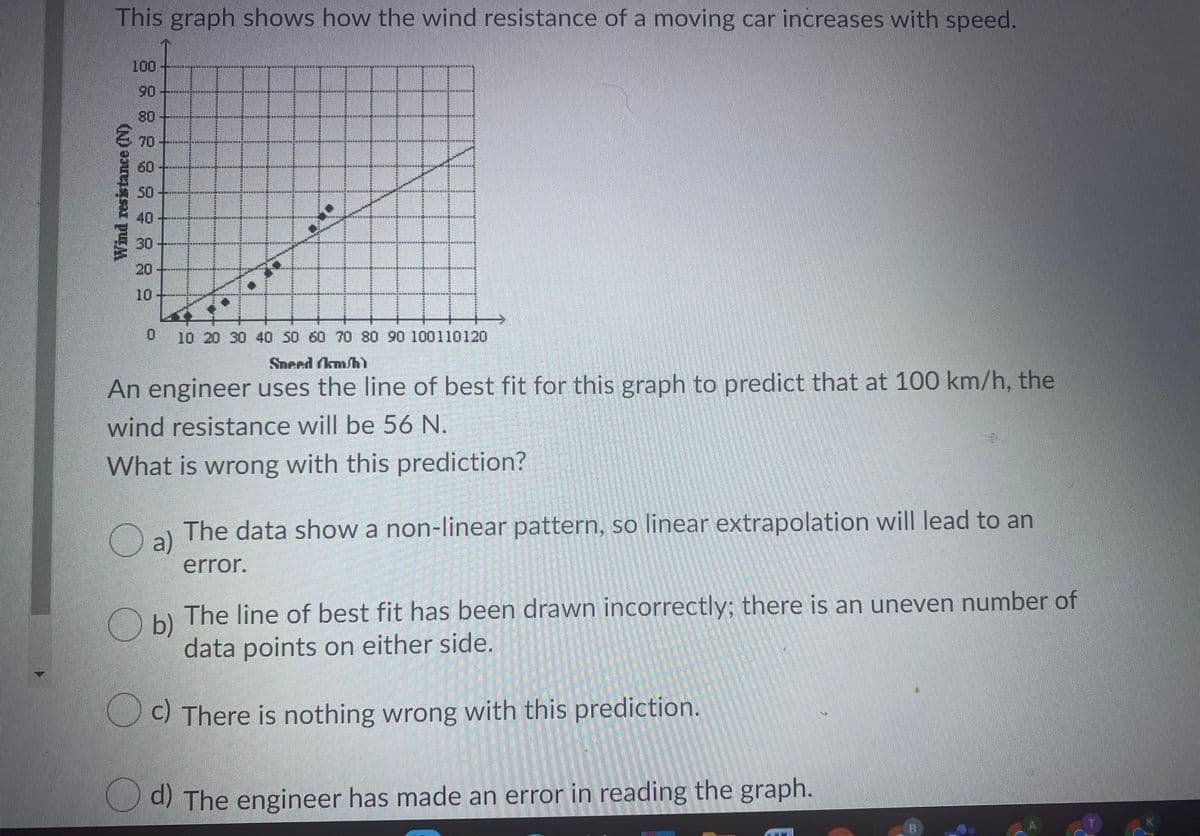
Transcribed Image Text:This graph shows how the wind resistance of a moving car increases with speed.
100
90 +
80
70
60---
50
40
30
南
20
10
0 10 20 30 40 S0 60 70 80 90 100110120
Sneed (km/
An engineer uses the line of best fit for this graph to predict that at 100 km/h, the
wind resistance will be 56 N.
What is wrong with this prediction?
Oa The data show a non-linear pattern, so linear extrapolation will lead to an
a)
error.
The line of best fit has been drawn incorrectly; there is an uneven number of
b)
data points on either side.
O c) There is nothing wrong with this prediction.
d) The engineer has made an error in reading the graph.
Wind resistance (N)
Expert Solution
This question has been solved!
Explore an expertly crafted, step-by-step solution for a thorough understanding of key concepts.

This is a popular solution!

Trending now
This is a popular solution!

Step by step
Solved in 2 steps

Recommended textbooks for you
Algebra: Structure And Method, Book 1
Algebra
ISBN:
9780395977224
Author:
Richard G. Brown, Mary P. Dolciani, Robert H. Sorgenfrey, William L. Cole
Publisher:
McDougal Littell

Functions and Change: A Modeling Approach to Coll…
Algebra
ISBN:
9781337111348
Author:
Bruce Crauder, Benny Evans, Alan Noell
Publisher:
Cengage Learning

Glencoe Algebra 1, Student Edition, 9780079039897…
Algebra
ISBN:
9780079039897
Author:
Carter
Publisher:
McGraw Hill
Algebra: Structure And Method, Book 1
Algebra
ISBN:
9780395977224
Author:
Richard G. Brown, Mary P. Dolciani, Robert H. Sorgenfrey, William L. Cole
Publisher:
McDougal Littell
Functions and Change: A Modeling Approach to Coll…
Algebra
ISBN:
9781337111348
Author:
Bruce Crauder, Benny Evans, Alan Noell
Publisher:
Cengage Learning
Glencoe Algebra 1, Student Edition, 9780079039897…
Algebra
ISBN:
9780079039897
Author:
Carter
Publisher:
McGraw Hill

Trigonometry (MindTap Course List)
Trigonometry
ISBN:
9781337278461
Author:
Ron Larson
Publisher:
Cengage Learning

Algebra & Trigonometry with Analytic Geometry
Algebra
ISBN:
9781133382119
Author:
Swokowski
Publisher:
Cengage