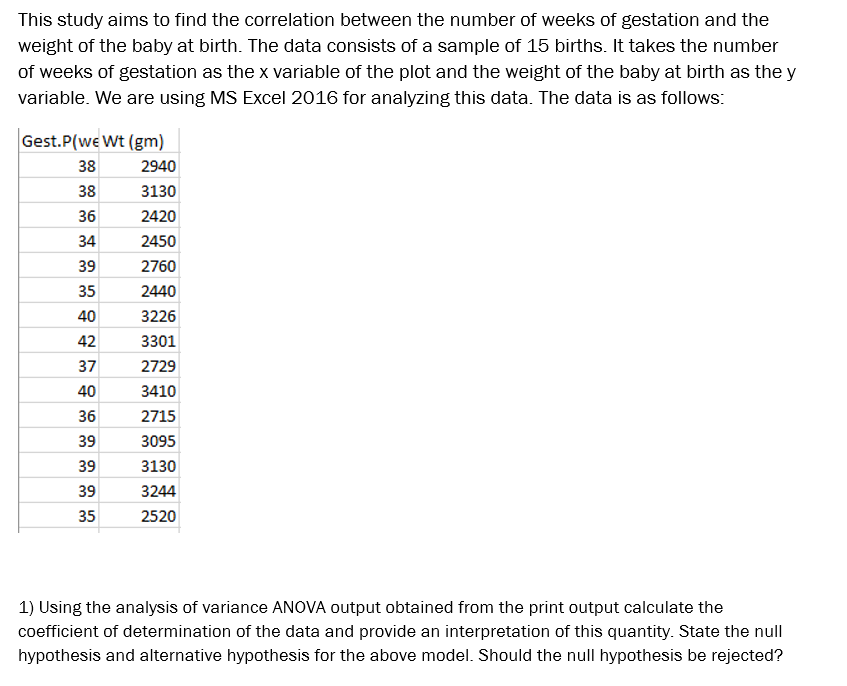
This study aims to find the correlation between the number of weeks of gestation and the weight of the baby at birth. The data consists of a sample of 15 births. It takes the number of weeks of gestation as the x variable of the plot and the weight of the baby at birth as the y variable. We are using MS Excel 2016 for analyzing this data. The data is as follows: Gest.P(we Wt (gm) 38 2940 38 3130 36 2420 34 2450 39 2760 35 2440 40 3226 42 3301 37 2729 40 3410 36 2715 39 3095 39 3130 39 3244 35 2520 1) Using the analysis of variance ANOVA output obtained from the print output calculate the coefficient of determination of the data and provide an interpretation of this quantity. State the null hypothesis and alternative hypothesis for the above model. Should the null hypothesis be rejected?


Correlation
Correlation defines a relationship between two independent variables. It tells the degree to which variables move in relation to each other. When two sets of data are related to each other, there is a correlation between them.
Linear Correlation
A correlation is used to determine the relationships between numerical and categorical variables. In other words, it is an indicator of how things are connected to one another. The correlation analysis is the study of how variables are related.
Regression Analysis
Regression analysis is a statistical method in which it estimates the relationship between a dependent variable and one or more independent variable. In simple terms dependent variable is called as outcome variable and independent variable is called as predictors. Regression analysis is one of the methods to find the trends in data. The independent variable used in Regression analysis is named Predictor variable. It offers data of an associated dependent variable regarding a particular outcome.

Step by step
Solved in 2 steps with 3 images


