Three randomly selected households are surveyed. The numbers of people in the households are 1, 3, and 8. Assume that samples of size n= 2 are randomly selected with replacement from the population of 1, 3, and 8. Construct a probability distribution table that describes the sampling distribution of the proportion of odo numbers when samples of sizes n =2 are randomly selected. Does the mean of the sample proportions equal the proportion of odd numbers in the population? Do the sample proportions target the value of the population proportion? Does the sample proportion make a good estimator of the population proportion? Listed be are the nine possible samples. 1,1 1,3 1,8 3,1 3,3 3,8 8,1 8,3 8,8 D Construct the probability distribution table. Sample Proportion Probability (Type an integer or fraction.) Choose the correct answer below. O A. The proportion of odd numbers in the population is not equal to the mean of the sample proportions. O B. The proportion of odd numbers in the population is equal to the mean of the sample proportions. O C. The proportion of even numbers in the population is equal to the mean of the sample proportions of odd numbers.
Three randomly selected households are surveyed. The numbers of people in the households are 1, 3, and 8. Assume that samples of size n= 2 are randomly selected with replacement from the population of 1, 3, and 8. Construct a probability distribution table that describes the sampling distribution of the proportion of odo numbers when samples of sizes n =2 are randomly selected. Does the mean of the sample proportions equal the proportion of odd numbers in the population? Do the sample proportions target the value of the population proportion? Does the sample proportion make a good estimator of the population proportion? Listed be are the nine possible samples. 1,1 1,3 1,8 3,1 3,3 3,8 8,1 8,3 8,8 D Construct the probability distribution table. Sample Proportion Probability (Type an integer or fraction.) Choose the correct answer below. O A. The proportion of odd numbers in the population is not equal to the mean of the sample proportions. O B. The proportion of odd numbers in the population is equal to the mean of the sample proportions. O C. The proportion of even numbers in the population is equal to the mean of the sample proportions of odd numbers.

College Algebra (MindTap Course List)
12th Edition
ISBN:9781305652231
Author:R. David Gustafson, Jeff Hughes
Publisher:R. David Gustafson, Jeff Hughes
Chapter8: Sequences, Series, And Probability
Section8.7: Probability
Problem 5E: List the sample space of each experiment. Rolling one die and tossing one coin

Related questions
Question
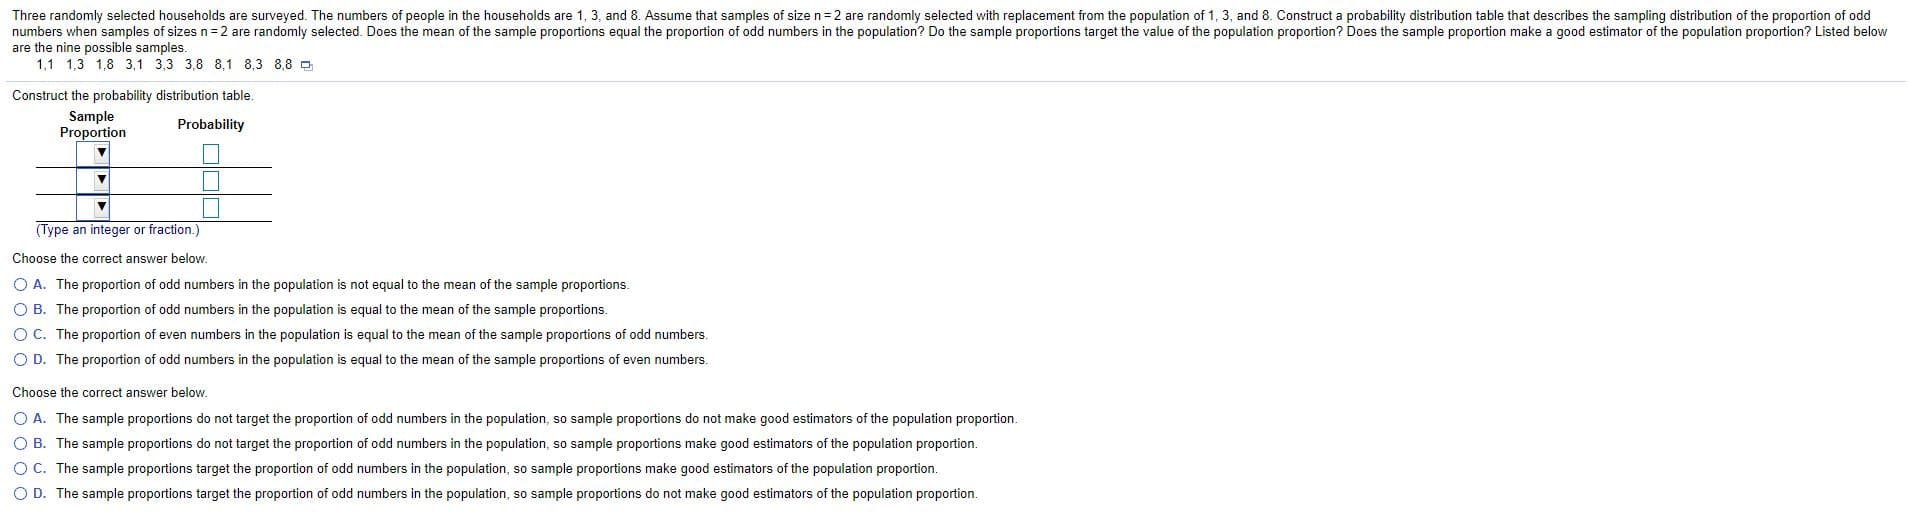
Transcribed Image Text:Three randomly selected households are surveyed. The numbers of people in the households are 1, 3, and 8. Assume that samples of size n= 2 are randomly selected with replacement from the population of 1, 3, and 8. Construct a probability distribution table that describes the sampling distribution of the proportion of odo
numbers when samples of sizes n =2 are randomly selected. Does the mean of the sample proportions equal the proportion of odd numbers in the population? Do the sample proportions target the value of the population proportion? Does the sample proportion make a good estimator of the population proportion? Listed be
are the nine possible samples.
1,1 1,3 1,8 3,1 3,3 3,8 8,1 8,3 8,8 D
Construct the probability distribution table.
Sample
Proportion
Probability
(Type an integer or fraction.)
Choose the correct answer below.
O A. The proportion of odd numbers in the population is not equal to the mean of the sample proportions.
O B. The proportion of odd numbers in the population is equal to the mean of the sample proportions.
O C. The proportion of even numbers in the population is equal to the mean of the sample proportions of odd numbers.
Expert Solution
This question has been solved!
Explore an expertly crafted, step-by-step solution for a thorough understanding of key concepts.

This is a popular solution!

Trending now
This is a popular solution!

Step by step
Solved in 2 steps

Knowledge Booster


Learn more about
Need a deep-dive on the concept behind this application? Look no further. Learn more about this topic, probability and related others by exploring similar questions and additional content below.Recommended textbooks for you
College Algebra (MindTap Course List)
Algebra
ISBN:
9781305652231
Author:
R. David Gustafson, Jeff Hughes
Publisher:
Cengage Learning
College Algebra (MindTap Course List)
Algebra
ISBN:
9781305652231
Author:
R. David Gustafson, Jeff Hughes
Publisher:
Cengage Learning