Three statistics classes (50 students each) took the same test. Shown below are histograms of the scores for the classes. Use the histograms to answer the question. Which class do you think performed better on the test? a.Class 2, because it has different mean and median and 70% of class 2 scored at or above the medians of 1 and 3. b. Class 2, because it has the highest median and 70% of class 2 scored at or above the medians of 1 and 3. c. Class 1, because it has the smallest median and 70% of class 1 scored at or above the medians of 2 and 3. d. Class 3, because 74% of class 3 scored at or above the medians of 1 and 2. e. Class 2, because it has the highest median and 50% of class 2 scored at or above the medians of 1 and 3.
Three statistics classes (50 students each) took the same test. Shown below are histograms of the scores for the classes. Use the histograms to answer the question. Which class do you think performed better on the test? a.Class 2, because it has different mean and median and 70% of class 2 scored at or above the medians of 1 and 3. b. Class 2, because it has the highest median and 70% of class 2 scored at or above the medians of 1 and 3. c. Class 1, because it has the smallest median and 70% of class 1 scored at or above the medians of 2 and 3. d. Class 3, because 74% of class 3 scored at or above the medians of 1 and 2. e. Class 2, because it has the highest median and 50% of class 2 scored at or above the medians of 1 and 3.

Trigonometry (MindTap Course List)
10th Edition
ISBN:9781337278461
Author:Ron Larson
Publisher:Ron Larson
Chapter5: Exponential And Logarithmic Functions
Section5.5: Exponential And Logarithmic Models
Problem 5ECP

Related questions
Question
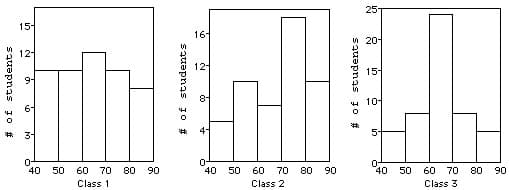
Three statistics classes (50 students each) took the same test. Shown below are histograms of the scores for the classes. Use the histograms to answer the question.
Which class do you think performed better on the test?
a.Class 2, because it has different mean and median and 70% of class 2 scored at or above the medians of 1 and 3.
b. Class 2, because it has the highest median and 70% of class 2 scored at or above the medians of 1 and 3.
c. Class 1, because it has the smallest median and 70% of class 1 scored at or above the medians of 2 and 3.
d. Class 3, because 74% of class 3 scored at or above the medians of 1 and 2.
e. Class 2, because it has the highest median and 50% of class 2 scored at or above the medians of 1 and 3.
Transcribed Image Text:15
4-
40 50 60 70 80 90
40 50 60 70 80
90
40
50 60 70
80
06
Class 1
Class 2
Class 3
# of students
# of students
#of students
Expert Solution
Step 1
Given:
Proved three histogram

Trending now
This is a popular solution!

Step by step
Solved in 2 steps

Recommended textbooks for you
Trigonometry (MindTap Course List)
Trigonometry
ISBN:
9781337278461
Author:
Ron Larson
Publisher:
Cengage Learning


Algebra & Trigonometry with Analytic Geometry
Algebra
ISBN:
9781133382119
Author:
Swokowski
Publisher:
Cengage
Trigonometry (MindTap Course List)
Trigonometry
ISBN:
9781337278461
Author:
Ron Larson
Publisher:
Cengage Learning
Algebra & Trigonometry with Analytic Geometry
Algebra
ISBN:
9781133382119
Author:
Swokowski
Publisher:
Cengage

Algebra: Structure And Method, Book 1
Algebra
ISBN:
9780395977224
Author:
Richard G. Brown, Mary P. Dolciani, Robert H. Sorgenfrey, William L. Cole
Publisher:
McDougal Littell