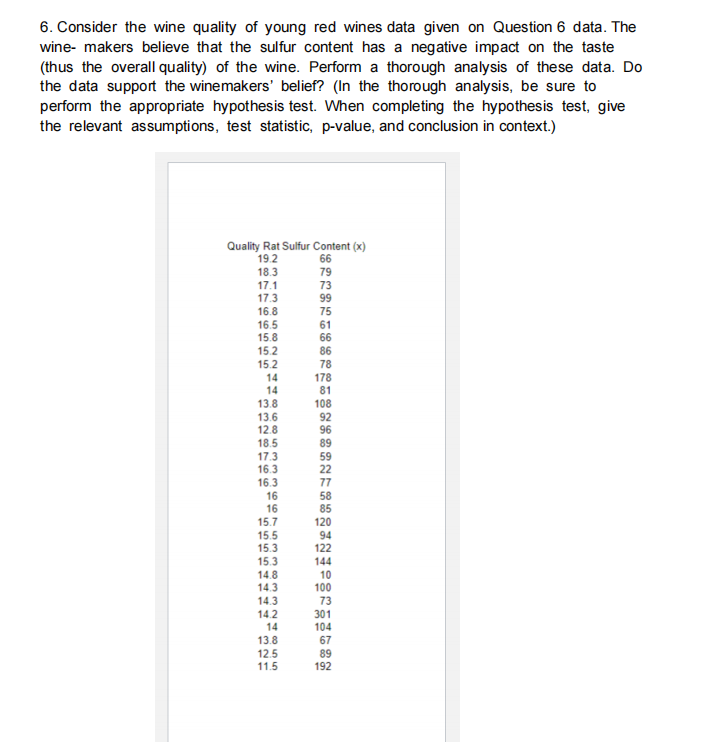
(thus the overall quality) of the wine. Perform a thorough analysis of these data. Do the data support the winemakers' belief? (In the thorough analysis, be sure to perform the appropriate hypothesis test. When completing the hypothesis test, give the relevant assumptions, test statistic, p-value, and conclusion in context.)


Q: Can you please breakdown the hypothesis in the soltuion into words instead of an equation for me to…
A: The hypothesis is a statement about the population parameter. There are two types of hypothesis…
Q: A researcher wants to determine if there is a significant difference in the average math scores of…
A:
Q: The peanut crop was harvested from five fields of various area. The following data are the mass of…
A: Here, it is given x y 2.01 7280 3.93 15730 3.68 13590 4.33 19820 2.33 12860 The…
Q: Volume of Histogram: Imagine a histogram (bar graph). Design an algorithm to compute the volume of…
A: Given is the data in the histogram 0 0 4 0 0 6 0 0 3 0 5 0 1 0 0 0
Q: A researcher claims that the average time people spend commuting to work is more than 25 minutes. To…
A: To test the hypothesis, we can use a one-sample t-test. The null hypothesis is that the average time…
Q: Jeremy is looking at the relationship between the height of a person and their shoe size. He takes a…
A: The table shows the person height and shoe size.
Q: Which of the Set A: 12, 27, 9, 18, 12, 21 Set B: 9, 14, 8, 11, 9, 12 Set A following data sets has…
A: Solution: First we find means and standard deviations for both the data sets. x (x-x)2 12…
Q: You observe a sample of five numbers between 0 and 10. Their median is 5 and their mean is 5. What…
A: The numbers are between 0 to 10. The mean is the ratio of the sum of all observations to the total…
Q: A study is conducted to compare the effectiveness of three different teaching methods (A, B, and C)…
A: From the provided information, Number of variables (k) = 3 Chi-square test statistic = 20
Q: The following scatterplot shows the relationship between the amount of money spent (budget) and the…
A: Here, from the given scatter plot we have to identify the correct option
Q: The distribution of blood types for 100 Americans is listed in the table. If one donor is selected…
A: Given that Total number of 100 Americans. We have to find probability of AB-
Q: According to the U.S. Census Bureau, 42.8% of U.S. households connected to the Internet using a…
A: Given that The Cable modem users are 42.8% The mobile broadband users are 33.1% The DSL users are…
Q: At the local liquour store, a single purchase approximately follows a normal distribution with a…
A: Given that. X~N( μ , ?) μ=81 , ?=19.15 Z-score =( x - μ )/?
Q: The descriptive statistics presented below are the summary measures for the number of listings for…
A: We have to draw conclusions considering both the given table information for Female realtors and…
Q: A sample of size 8 was collected from an unknown population 7 9 10 11 11 | 12 | 13 | 15 1. Use the…
A: Given data: 7, 9, 10, 11, 11, 12, 13, 15
Q: can this be solved with a Z table please?
A: Yes, the questions can be solved using a Z table, please find the work below with the attached Z…
Q: A survey was conducted to determine the difference in the average height of adult males before and…
A:
Q: A study wants to test the mean time that people take to finish a crossword puzzle. The null…
A: Givensample size(n)=30Mean(x)=24standard deviation(s)=5significance level(α)=0.05
Q: The second question is also missing!!
A: From the given table, Total number of survey responses is 459. The frequency for 1 meal during the…
Q: Soft Shoes, a shoe store, sold $1,528 pairs of blue slippers last week. If that amount is 11.5% of…
A: We have given, A shoe store sold $1528 pairs of blue slippers last week. And their total sales from…
Q: A statistics department consisting of 27 faculty has a median salary of 54000. One of the senior…
A: Given Total no. of faculty = 27 The median salary is 54,000. Senior faculty with 74,000 salary has…
Q: Three cards are drawn in succession from a deck without replacement. Find the probability…
A: It is given that three cards are drawn in succession from a deck without replacement.
Q: Pew Research reported in 2012 that the typical response rate to their surveys is only 9%. If for a…
A: Here given that Pew Research reported in 2012 that the typical response rate to their surveys is…
Q: hy is the numerator always 1 for the F-statistic?
A: The number of iron supplements = 10 The contrasts in the mean = 9 α = 0.05 j = 9
Q: The boxplot below shows the number of deaths attributed to UV radiation in African countries and…
A: A box and whisker plot is used to describe the distribution of data. It represents the five number…
Q: The time it takes, in hours, for tickets to be sold out for an AC/DC concert follows a uniform…
A:
Q: The six measurements that follow are furnace temperatures recorded on successive batches in a…
A: Given data: 953, 950, 948, 955, 951, 955.
Q: Think of 3 different real life applications you use probabilities personally to make decisions for…
A: Real-life examples related to probability.
Q: to) 01)} W(o)= {x: L(x,00) > KL(x,0₁)} nstant .If o* is another test, show that a(o) + kß(o) ≤ α(0*)…
A: This inequality states that the sum of the type I error rate and k times the type II error rate of a…
Q: What is the probability that a randomly chosen child has a height of less than 48.35 inches?…
A: Given that Mean=M=53.1, Standard deviations=Sd=2.1
Q: The systolic blood pressure dataset (in the third sheet of the spreadsheet linked above) contains…
A: The data shows the age and systolic blood pressure of 30 randomly selected patients in a medical…
Q: A survey of 500 college students moving into their dorm revealed that 425 brought a microwave, 380…
A: The sample size is N=500 The event M is brought a microwave The event C is brought a video game…
Q: The joint density function of the random variables X₁, X2, X3 is given as f(x1, 22, 23) = Find(where…
A:
Q: 21. Answer the following questions given the two histograms in Figure 7.5. rger standard deviation…
A: The objective is to compare the standard deviations and the means of both histograms. For the given…
Q: In a particular bag of skittles, there are 9 red, 9 orange, 10 green, 12 yellow, and 15 purple…
A: GivenIn a bagNo.of red skittles=9No.of orange skittles=9No.of green skittles=10No.of yellow…
Q: Stem-and-leaf of C1 N = ? Leaf Unit = 0.1 6…
A: Given stem and leaf plot: Leaf Unit = 0.1 6 2 133788 15 3…
Q: Let Y be a random variable having characteristic function Find () EX] (1) E[X²] (m) Var[X] 0.8 1-0.2
A: Characteristics function of random variable X : Φx(t)=0.8/(1-0.2eit) To find 1): E(x) 2): E(x2) 3):…
Q: prove it how logistic distribution is a limiting distribution of standard mid range in random sample
A: Given information: Logistic distribution is the limiting distribution of the standard mid range of…
Q: Here's a game to consider. We throw a pair of dice. If the sum is 2, 11, or 12, you win. If the sum…
A: If we throw a pair of dice, then the sample space is S={(i, j): i=1, 2,.., 6; j=1, 2,..., 6}. The…
Q: We are given three strange coins. One has heads on both faces, the second has tails on both faces,…
A: Given information: Three coins are given.
Q: A researcher wants to test the hypothesis that there is no significant linear relationship between…
A: Given that: Sample size, n=100 Correlation coefficient, r=0.23
Q: Another name for the expected value of an investment would be: Answer a. The mean value b. The…
A: Introduction The expected value (EV) of an investment can be defined as the anticipated value for an…
Q: A business bus travels 25 miles at 25mph, 25 miles at 50 mph, and 25 miles at 75mph. Calculate the…
A: GivenA business bus travels 25 miles at25 mph,50 mph,75 mphsample size(n)=3
Q: Consider a continuous random variable X with a normal distribution and mean of 50 and standard…
A: For the variable X, which is normally distributed, it is given that: μ mean=50σ standard…
Q: b) c) Explain to Xuemei why the portfolio standard deviation is not simply the weighted average of…
A: The portfolio is the larger range of investments made by the investors. Expected portfolio return…
Q: d. In an effort to reduce costs, the assembly instructions were rewritten with fewer pages. The…
A: Let p be the population proportion of all customers who purchase a bicycle called the helpline.…
Q: pose a standard antibiotic kills a particular type of bacteria 80% of the eria. Using principles of…
A: Yes, a sample size of 100 is sufficiently large to discover whether the new drug is "significantly…
Q: Ten years ago, the town of Easton decided to increase its annual spending on education so that its…
A: From the given information, we have to find the difference-in-differences estimator.
Q: A study was done on the timeliness of flights categorized as either "on time" or "delayed" of two…
A: Given that The study is done on the timeliness of flights of two major airlines. The airlines are…
Q: A study was performed on wear of a bearing y and its relationship to x₁ = oil viscosity and x2 =…
A: (a) Procedure to conduct multiple regression using excel: Enter the data of y, x1, and x2 in an…

Step by step
Solved in 2 steps with 1 images

- . The term sample usually refers to a sample that ___ - Consists of people with chemical dependency problems - Uses the same group of individuals with a before/after measurement - Requires a dependent variable for hypothesis testing - Is randomly selected from two dependent populationsThe director of marketing at Vanguard Corporation believes that sales of the company's Bright Side laundry detergent (S) are related to Vanguard's own advertising expenditures (A), as well as the combined advertising expenditures of its three biggest rival detergents (R).The marketing director collects 36 weekly observations on S, A, and R . Vanguard's marketing director is comfortable using parameter estimates that are statistically significant at the 10 percent level or better. Give the specific statistical tool that can be used to this problem.Did the ductility of the wire change after soaking it to an acid solution? Infer from the data below: Ductility before soaking Ductility after soaking 2563 2405 2564 2406 2565 2407 2566 2408 2567 2409 2452 2693 2453 2694 2454 2695 2455 2696 2456 2697 2634 2589 2635 2590 2636 2591 2637 2592 1.) Create a null and alternative hypothesis 2.) Is there a significant change before and after soaking? Prove it using computations
- As a result of complaints from customers about delivery times, the manager at a pizza delivery service is ready to undertake a study to determine the average delivery time. Until now, the manager has believed the delivery time was 20 minutes. Question content area bottom Part 1 What are the null and alternative hypotheses? H0: ▼ Upper X overbarX sigmaσ ss betaβ muμ alphaα ▼ equals= not equals≠ enter your response here H1: ▼ sigmaσ alphaα ss Upper X overbarX betaβ muμ ▼ equals= not equals≠ enter your response here"In your response indicate whether CPAs in states that have flat state income tax rates work fewer hours per week during tax season compared to the US average. You will want to formally set up H0 and Ha, report either the test statistic (z-value) or p-value, and explain why you either reject or fail to reject your null hypothesis."As a researcher for the EPA, you have been asked to determine if the air quality in the UnitedStates has changed over the past 2 years. You select a random sample of 10 metropolitan areasand find the number of days each year that the areas failed to meet acceptable air quality Based on the data, answer the following questions.1. What is the purpose of the study?2. Are the samples independent or dependent?3. What hypotheses would you use?4. What is (are) the critical value(s) that you would use?5. What statistical test would you use?6. How many degrees of freedom are there?7. What is your conclusion?8. Could an independent means test have been used?9. Do you think this was a good way to answer the original question?
- If your question is that your significant hypothesis test is significant “enough” to have true meaning, what are some other things you can look at to determine practical significance?Suppose we take a sample of 2,500 blood donors from a population for which 50% (0.5) have type O+ blood. (a) Into what range of possible values should the sample proportion fall 95% of the time, according to the Empirical Rule? to (b) If the sample included only 625 donors instead of 2,500, would the range of possible sample proportions be wider, more narrow, or the same as with a sample of 2,500 donors? Explain your answer, and explain why it makes intuitive sense. The range would be with 625 donors compared to a sample of 2,500 donors since the standard deviation of the sampling distribution would be . This makes intuitive sense because if fewer donors are included in the sample, the proportion will be reliable as an estimate of the proportion.Use the method of hypothesis testing to determine if Ryan should conclude his saplings are growing. Take a 5% significance level.
- which of the following individuals is likely to be excluded from a clinical trial? a-individual with other diseases besides the disease of interest b-an individual whose data is considered to be an outlier c-an individual of who is considered to be a minority d-an individual who will have difficulty complying trial protocols.Consider the following: In general, when people diet they typically lose 10 lbs. (?σ = 2). A random sample of 16 people on the keto diet lost 15 lbs. Do people on the keto diet lose more or less weight than people on diets in general? 4. What is the research hypothesis? a) Weight loss in the keto diet sample does not differ from weight loss in the population of dieters in general (H1: X-bar = Mu) b)Weight loss in the keto diet sample does differ from weight loss in the population of dieters in general (H1: X-bar = Mu) c) Weight loss in the keto diet sample does not differ from weight loss in the population of dieters in general (H1: X-bar does not equal Mu) d) Weight loss in the keto diet sample does differ from weight loss in the population of dieters in general (H1: X-bar does not equal Mu)QUESTION 18 A researcher notes that there seems to be a difference in the prevalence of high blood pressure among college-educated individuals who consume low amounts of processed foods and the prevalence of individuals who only have a high school education and consume high amounts of processed foods. Use the appropriate hypothesis to test for the independence of the two independent variables presented here at the 5% significance level to ensure confounding has not influenced the study’s results. Then, interpret your response. Diet Low in Processed Foods Normal BP High BP Total College Education 124 55 179 High School Education 69 152 221 Total 193 207 400 Diet High in Processed Foods Normal BP High BP Total College Education 64 85 149 High School Education 98 153 251 Total 162 238 400 The chi square value of 37.724 is higher than the chi square value of 3.84; therefore, we do not reject H0 at the 5% level and reject H1, which states that level…