Time left 1:08:43 Suppose that, following a decrease in the supply of good X, we observe that the price of goodY increases. If no other curves have shifted, which of the following can we infer? O A. None of the above. O B. Good X is an inferior good. O C. Goods X and Y are complements. O D. Goods X and Y are substitutes.
Time left 1:08:43 Suppose that, following a decrease in the supply of good X, we observe that the price of goodY increases. If no other curves have shifted, which of the following can we infer? O A. None of the above. O B. Good X is an inferior good. O C. Goods X and Y are complements. O D. Goods X and Y are substitutes.

Principles of Economics 2e
2nd Edition
ISBN:9781947172364
Author:Steven A. Greenlaw; David Shapiro
Publisher:Steven A. Greenlaw; David Shapiro
Chapter6: Consumer Choices
Section: Chapter Questions
Problem 11RQ: As a general rule, is it safe to assume that a change in the price of a good will always have its...

Related questions
Question
100%
Just the answer dont tell me why please
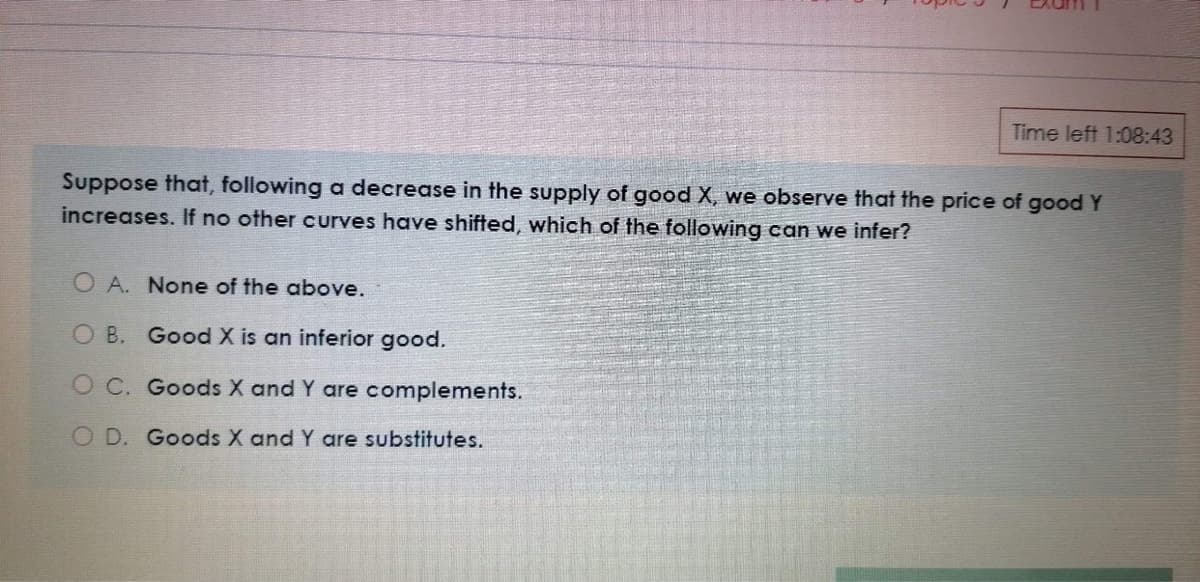
Transcribed Image Text:Time left 1:08:43
Suppose that, following a decrease in the supply of good X, we observe that the price of goodY
increases. If no other curves have shifted, which of the following can we infer?
O A. None of the above.
O B. Good X is an inferior good.
O C. Goods X and Y are complements.
O D. Goods X and Y are substitutes.
Expert Solution
This question has been solved!
Explore an expertly crafted, step-by-step solution for a thorough understanding of key concepts.

This is a popular solution!

Trending now
This is a popular solution!

Step by step
Solved in 2 steps

Knowledge Booster


Learn more about
Need a deep-dive on the concept behind this application? Look no further. Learn more about this topic, economics and related others by exploring similar questions and additional content below.Recommended textbooks for you
Principles of Economics 2e
Economics
ISBN:
9781947172364
Author:
Steven A. Greenlaw; David Shapiro
Publisher:
OpenStax

Essentials of Economics (MindTap Course List)
Economics
ISBN:
9781337091992
Author:
N. Gregory Mankiw
Publisher:
Cengage Learning

Principles of Economics 2e
Economics
ISBN:
9781947172364
Author:
Steven A. Greenlaw; David Shapiro
Publisher:
OpenStax
Essentials of Economics (MindTap Course List)
Economics
ISBN:
9781337091992
Author:
N. Gregory Mankiw
Publisher:
Cengage Learning