Tiple covariance Szy Sample formula ¸Σ₁=₁(x¡—x)*(Yi−y) n-1 Sxy=

Algebra & Trigonometry with Analytic Geometry
13th Edition
ISBN:9781133382119
Author:Swokowski
Publisher:Swokowski
Chapter10: Sequences, Series, And Probability
Section10.8: Probability
Problem 31E

Related questions
Question
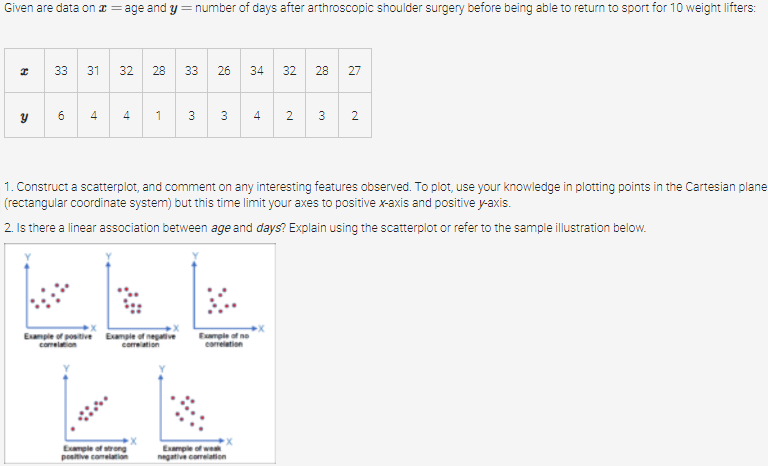
Transcribed Image Text:Given are data on = age and y = number of days after arthroscopic shoulder surgery before being able to return to sport for 10 weight lifters:
I
33
31
32 28 33
26 34 32
28 27
y
6
4
4
1
3
3
4
2
3 2
1. Construct a scatterplot, and comment on any interesting features observed. To plot, use your knowledge in plotting points in the Cartesian plane
(rectangular coordinate system) but this time limit your axes to positive x-axis and positive y-axis.
2. Is there a linear association between age and days? Explain using the scatterplot or refer to the sample illustration below.
Example of positive Example of negative Example of no
comelation
correlation
correlation
Example of strong
positive correlation
Example of weak
negative correlation
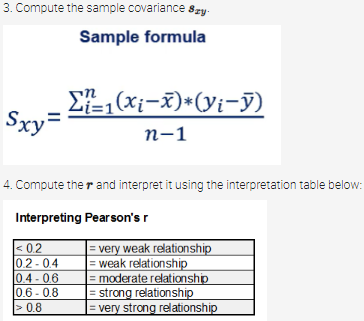
Transcribed Image Text:3. Compute the sample covariance szy
Sample formula
Σ₁(xi-x)*(yi-y)
Sxy=
n-1
4. Compute ther and interpret it using the interpretation table below:
Interpreting Pearson's r
<0.2
= very weak relationship
= weak relationship
0.2-0.4
0.4-0.6
= moderate relationship
= strong relationship
0.6-0.8
> 0.8
=
very strong relationship
Expert Solution
This question has been solved!
Explore an expertly crafted, step-by-step solution for a thorough understanding of key concepts.

This is a popular solution!

Trending now
This is a popular solution!

Step by step
Solved in 2 steps

Follow-up Questions
Read through expert solutions to related follow-up questions below.
Follow-up Question

Transcribed Image Text:4. Compute ther and interpret it using the interpretation table below:
Interpreting Pearson's r
< 0.2
= very weak relationship
= weak relationship
0.2-0.4
0.4-0.6
0.6-0.8
>0.8
= moderate relationship
= strong relationship
= very strong relationship

Transcribed Image Text:2. Is there a linear association between age and days? Explain using the scatterplot or refer to the
sample illustration below.
Example of positive Example of negative
Example of no
correlation
correlation
correlation
X
Example of strong
positive correlation
Example of weak
negative correlation
Solution
Recommended textbooks for you
Algebra & Trigonometry with Analytic Geometry
Algebra
ISBN:
9781133382119
Author:
Swokowski
Publisher:
Cengage
Algebra & Trigonometry with Analytic Geometry
Algebra
ISBN:
9781133382119
Author:
Swokowski
Publisher:
Cengage