TITLE: Comparison of the weekly allowance of male and female students Research Question: 1. How does the weekly allowance differ between the male and female students?
TITLE: Comparison of the weekly allowance of male and female students Research Question: 1. How does the weekly allowance differ between the male and female students?

Glencoe Algebra 1, Student Edition, 9780079039897, 0079039898, 2018
18th Edition
ISBN:9780079039897
Author:Carter
Publisher:Carter
Chapter10: Statistics
Section10.6: Summarizing Categorical Data
Problem 14CYU

Related questions
Topic Video
Question
100%
Practical Research
(Answer research question)
Transcribed Image Text:Table 1
NOITOBATI
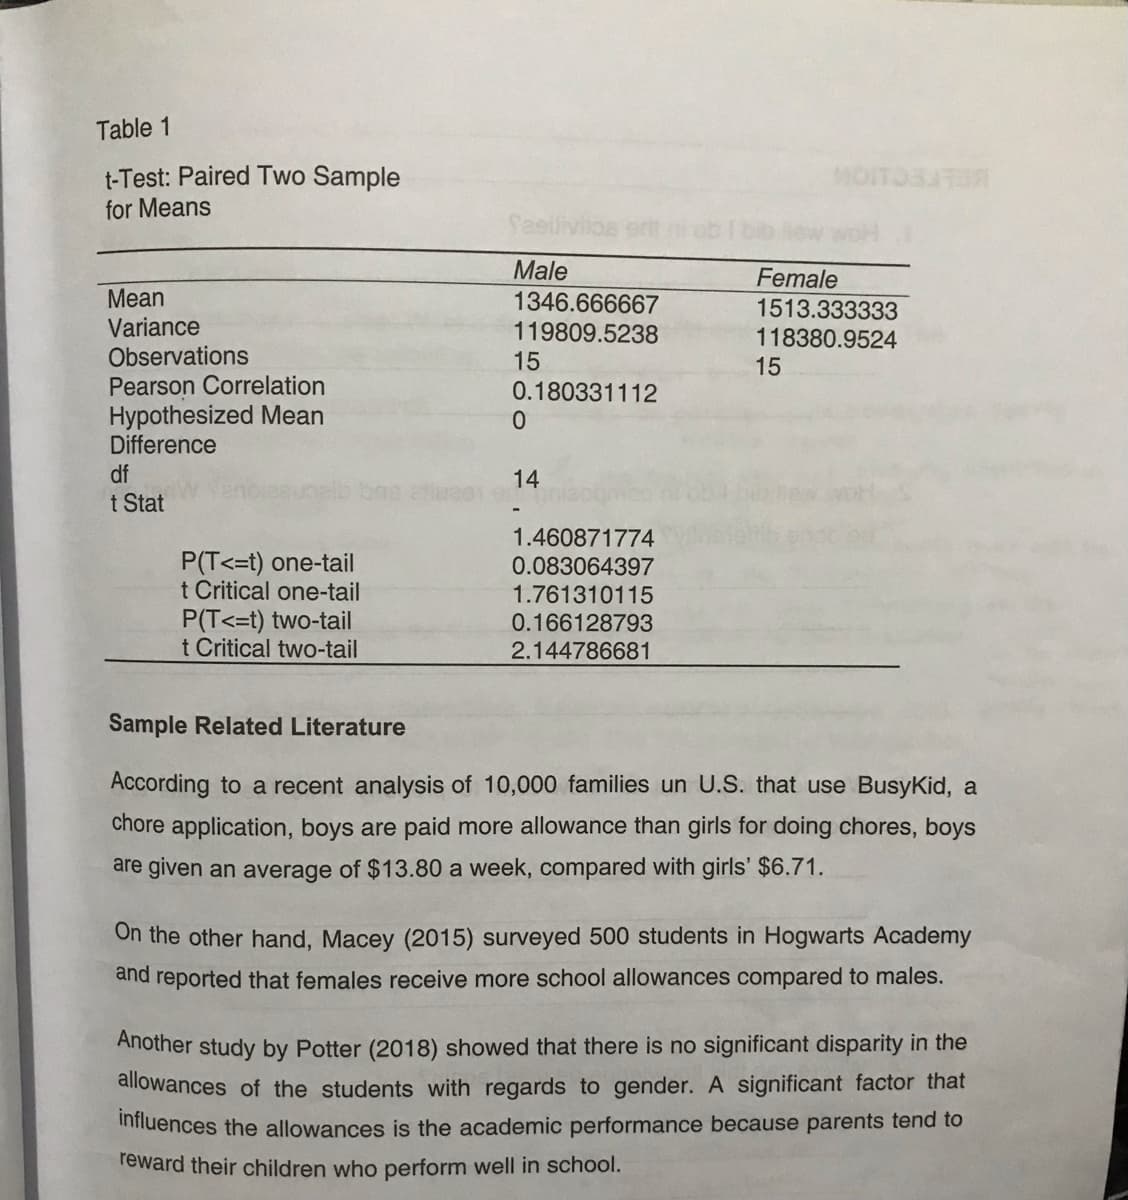
t-Test: Paired Two Sample
for Means
Seeiliviios
Male
Female
Mean
Variance
Observations
Pearson Correlation
Hypothesized Mean
Difference
1346.666667
119809.5238
15
1513.333333
118380.9524
15
0.180331112
0.
df
14
t Stat
1.460871774
P(T<=t) one-tail
t Critical one-tail
0.083064397
1.761310115
0.166128793
2.144786681
P(T<=t) two-tail
t Critical two-tail
Sample Related Literature
According to a recent analysis of 10,000 families un U.S. that use BusyKid, a
chore application, boys are paid more allowance than girls for doing chores, boys
are given an average of $13.80 a week, compared with girls' $6.71.
On the other hand, Macey (2015) surveyed 500 students in Hogwarts Academy
and reported that females receive more school allowances compared to males.
Another study by Potter (2018) showed that there is no significant disparity in the
allowances of the students with regards to gender. A significant factor that
Influences the allowances is the academic performance because parents tend to
reward their children who perform well in school.
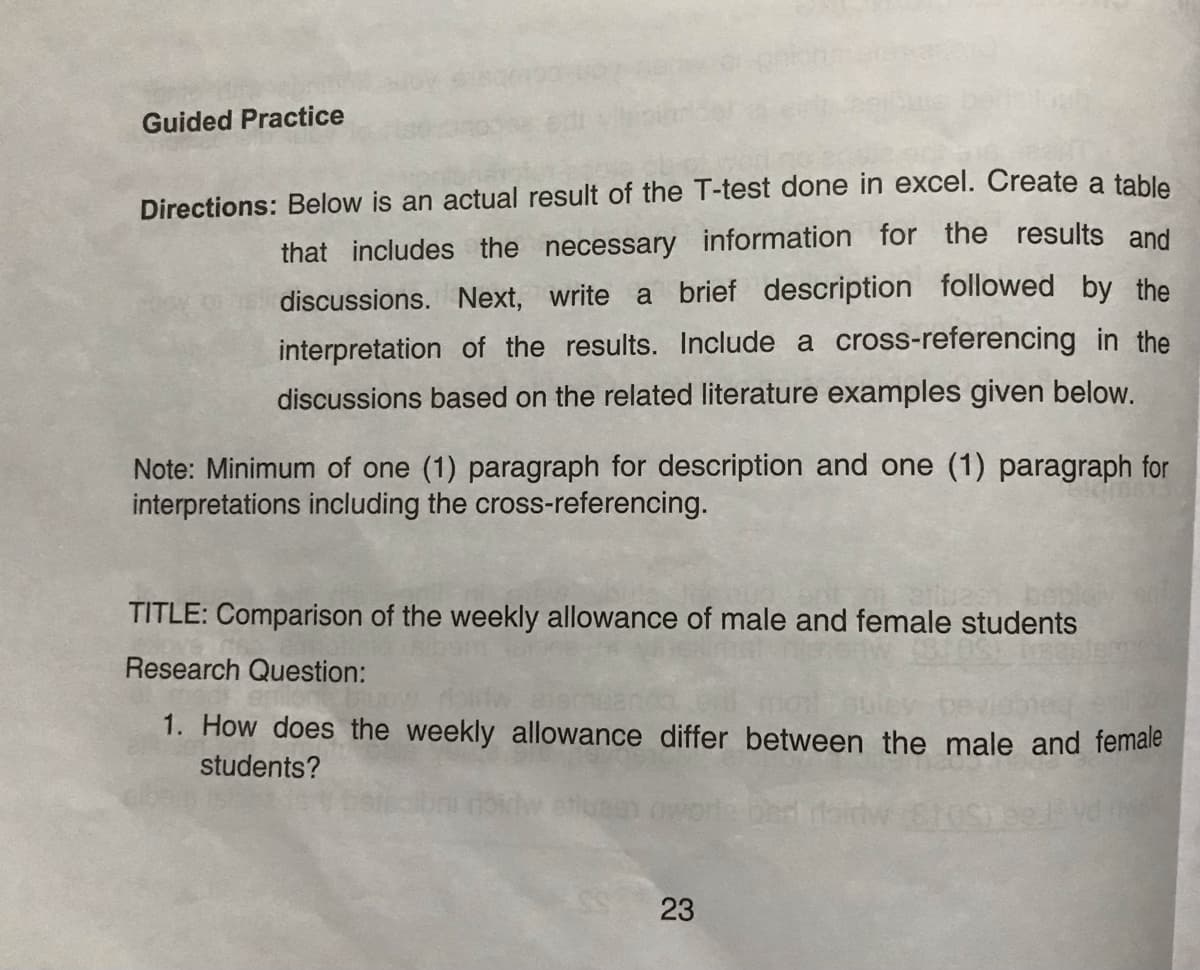
Transcribed Image Text:Guided Practice
Directions: Below is an actual result of the T-test done in excel. Create a table
that includes the necessary information for the results and
discussions. Next, write a brief description followed by the
interpretation of the results. Include a cross-referencing in the
discussions based on the related literature examples given below.
Note: Minimum of one (1) paragraph for description and one (1) paragraph for
interpretations including the cross-referencing.
TITLE: Comparison of the weekly allowance of male and female students
Research Question:
1. How does the weekly allowance differ between the male and female
students?
23
Expert Solution
This question has been solved!
Explore an expertly crafted, step-by-step solution for a thorough understanding of key concepts.

Step by step
Solved in 2 steps

Knowledge Booster


Learn more about
Need a deep-dive on the concept behind this application? Look no further. Learn more about this topic, statistics and related others by exploring similar questions and additional content below.Recommended textbooks for you
Glencoe Algebra 1, Student Edition, 9780079039897…
Algebra
ISBN:
9780079039897
Author:
Carter
Publisher:
McGraw Hill

Big Ideas Math A Bridge To Success Algebra 1: Stu…
Algebra
ISBN:
9781680331141
Author:
HOUGHTON MIFFLIN HARCOURT
Publisher:
Houghton Mifflin Harcourt

Algebra & Trigonometry with Analytic Geometry
Algebra
ISBN:
9781133382119
Author:
Swokowski
Publisher:
Cengage
Glencoe Algebra 1, Student Edition, 9780079039897…
Algebra
ISBN:
9780079039897
Author:
Carter
Publisher:
McGraw Hill
Big Ideas Math A Bridge To Success Algebra 1: Stu…
Algebra
ISBN:
9781680331141
Author:
HOUGHTON MIFFLIN HARCOURT
Publisher:
Houghton Mifflin Harcourt
Algebra & Trigonometry with Analytic Geometry
Algebra
ISBN:
9781133382119
Author:
Swokowski
Publisher:
Cengage