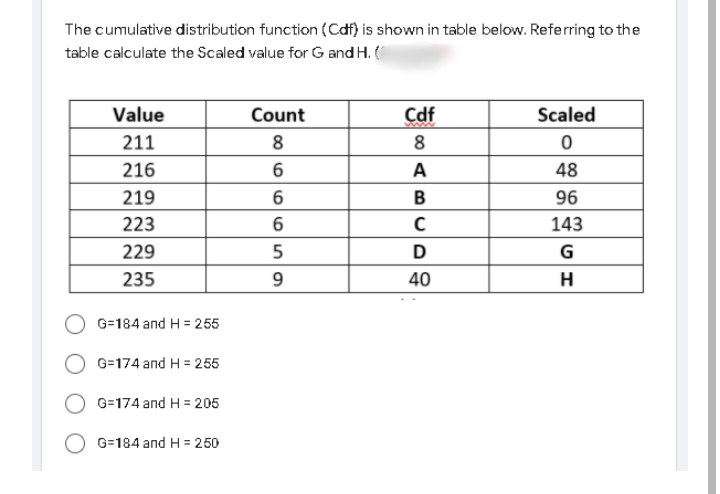
tive di Is snown in table below. cable calculate the Scaled value for G and H. ( Value Count Cdf 211 8 8 216 6 A 219 B 223 229 D 235 9 40


Q: A group of friends recorded the time it took to ride their bikes around the park. The scatter plot…
A:
Q: Height ( in cm) F 180-189 10 170-179 3 160-169 12
A: Given, Height(in cm) Number of girls 180-189 10 170-179 3 160-169 12 150-159 20 140-149…
Q: Elena is interested in whether music affects plant growth. For a science fair project, she will grow…
A: When a treatment is applied to a group and results are obtained after the treatment, the method is…
Q: Value Frequency 14 10 10 20 3. 28 35
A:
Q: An apartment complex wants to know if the residents are satisfied with the community park. 100…
A: Given that among 100 people 82 people are satisfied with the community park Therefore 82100×100=82%…
Q: Match the coefficient of determination to the scatter diagram. The scales on the x-axis and y-axis…
A: It is an important part of statistics. It is widely used.
Q: Square A has a side length of 6 cm. Square B is the resulting image after a scale factor of 2 has…
A: Given that , There are two squares as square A and square B where the scale factor between the…
Q: 10) f° 45° 107° g Note: Figure not drawn to scale. What is the value of a°? ) A) 28° B) 45° 62° D)…
A: We have to solve
Q: 2) Rachael has plotted 10 points on a scatter plot to investigate the relationship between two…
A: Given : There are 10 data points To find relation between two quantitative variables, we plot a…
Q: Español Eleven students were asked how many thiles they live from school. The results are shown in…
A: Given: A line plot of a data, To find: Mode and range of given data.
Q: Consider the diagram below. D A geometry student says; "I got lost in that lesson I wrote down that…
A: Correct is AD/AB=AB/AC
Q: Score Tally PPR Frequency (f) N= (P-LB)fp 100 N + |(P-L + Cfp L.B. <cf
A: Formula: PPR= 100N+(P-LB)fpi+cfp where, N= Total no. of observation i= class interval LB= lower…
Q: The right triangle on the right is a scaled copy of the right triangle on the left. Identify the…
A:
Q: Find the average rate of change of g(x) = 4x3 9. on the interval [-4, 1]. %3D - 24 Question Help:…
A:
Q: Demonstrate your knowledge of scale factors to complete the table below. Compare the ratio of the…
A:
Q: Match the coefficient of determination to the scatter diagram. The scales on the x-axis and y-axis…
A: (a).The coefficient of determination is the square of the correlation coefficient.The coefficient of…
Q: After determining whether the variation model below is of the form y = kx or y find the value of k.…
A: the given variation model is: we have to determine whether the variation model is of the form y=kx…
Q: B' 12 7.5 8 5 C A' C' 7.5
A:
Q: Determine whether the dilation is an enlargement or a reduction find the scale factor then write the…
A: Solve the following
Q: 7. Luke says that the scale factor relating two figures is 0.6. Paula says the scale factor is. If…
A: Scale factor
Q: What is the scale factor of the dilation shown? E' 15 10 4 F' D D' 4 8. 12 6.
A: given that □DEFG is dilated to □D'E'F'G'therfore□DEFG≈□D'E'F'G'from the given figureDE = 4,D'E' = 6
Q: What is the Scale Factor? * What is the scale factor of the dilation shown? B 12 7.5 8. 7.5 5.
A:
Q: Which of the following is a comparative scaling technique? a. Satisfaction Measurement Scale b.…
A: From the given options we have to choose which of the following is the comparative scaling…
Q: The data in the figure below represents the number of stars earned by 140 performers in a talent 35…
A: Given : Total number of performers = 140 Percentage bar diagram is given. Number of performers…
Q: Amelia plays basketball for her high school. She wants to improve to play at the college level. She…
A: Given: X Y 5 15 7 22 9 28 10 31 11 33 12 36
Q: В ZB а ZA A' b. ppose that m/A = 82°, a = 6.36, and b = 4.08. (The diagram above is not necessarily…
A:
Q: Jocelyn is training for a race by running several miles each day. She tracks her progress by…
A: The mean (average) of a data set is found by adding all numbers in the data set and then dividing by…
Q: Dilate (2, 5) by a scale factor of 3. A(6, 5) A B (2, 15) B (5,8) D D (6, 15)
A:
Q: )Graph the data given in the table below. Make sure the scale you choose is appropriate for the data…
A:
Q: SCUBA divers have maximum dive times they cannot exceed when going to different depths. The data in…
A: Given data, X Y X*Y X*X 50 176 8800 2500 60 163 9780 3600 70 151 10570 4900 80 139 11120…
Q: The right triangle on the right is a scaled copy of the right triangle on the left. Identify the…
A: The scale factor is a value with which we multiply a number to get another number. Here the right…
Q: The final letter grades earned on a mathematics course are given in the table below. A B C D F 12 20…
A: Given data A 9 B 12 C 20 D 10 F 4 W 5
Q: Trig Table Toolkit Approximate slope ratio as a fraction and a decimal Angle Slope triangle Ay Ay Ar…
A:
Q: For Exercise, write a statement in words that describes the variation model given. Use k as the…
A: There is multiplication between k and c2, and division between k and the square root of b. That is,…
Q: G 64 K 88 H 33 I Figure is not drawn to scale. KJ =
A: KJ = 24 The Triangle Proportionality Theorem states that if a line is parallel to one side of a…
Q: EVALUATION Direction: Encircle the letter of the correct answer. Refer to ASPY and AIRK for items 1–…
A: As shown in given diagram , △PYS~RKI 1) what are proportional side of corresponding side length?…
Q: What is the scale factor of the dilation shown? B B' 12 7.5 8 A A' C' 7.5 5 O A. 1 В. 2 3 С. 3 4. 3…
A:
Q: Some friends hire a taxi cab to travel to university. Consider the following table: No. of people 3…
A: Some friends hire a taxi cab to travel to university. The given table is: No, of people 1 2…
Q: What is the scale factor of the dilation shown? B B' 12 7.5 8. 5 A A' 7.5
A:
Q: What happens to a figure when it is dilated by a scale factorr=1? The image stays the same The image…
A: The objective of the question is choose the correct option.
Q: At Community Hospital, each full-time employee is required to work 2,080 hours annually. The table…
A: Given information Number of working hours annually = 2080 hours Employee Name Vacation Hours…
Q: The center of dilation is G and the scale factor is 5. G (12, 3) A (14, -7) Determine A’.
A:
Q: Υοu Try l! 1. Review the concepts related to range. 2. Study and solve the given data below. 3.…
A:
Q: 2a. What is the relationship between area and perimeter? Which perimeters is the least given the…
A: 2(a) Area is defined as space/region occupied by a two-dimensional flat object. It is measured in…
Q: Determine whether the dilation is an enlargement or a reduction find the scale factor then write the…
A: Given dilation is an enlargement. The dilation is centered at origin.
Q: 1) In Math, dilate means to and a figure? 2) If a scale factor is less than 1, the figure gets 3) If…
A: change the size , position
Q: A family has a monthly income of $3,600. Use the pie chart below to estimate the cost of…
A: We can estimate the result from pie chart.
Q: This table shows the amount of money a booster club makes for washing cars for a fundraiser. Use the…
A: Given points, (5,40) (10,70) (15,90) (20,100)
Q: 1. Blocks a, b, and c are all the same size. Which is the correct order of the scale readings? A. a…
A: We have to choose correct relation between reading scale of given object.

Step by step
Solved in 2 steps with 1 images


- The data from 200 endothermic reactions involving sodiumbicarbonate are summarized as follows:Detemine the cumulative distribution function for X.The probability density function of the random variable X is as in the picture with λ> 0. Investigate whether the most likelihood estimator (λ^) of λ is neutral.Let X have a Poisson distribution. If , find the mode of the distribution. Suppose Y has a uniform pdf over the interval [3,5]. Find its (1) first quartile, its (2) median, and (3) the sum of its third quartile and its ninth decile.
- Find Cumulative Distribution Function (cdf) of X, F(x), x {0, 1, 2,...}area to right of 2.821 under a t-distribution with 9 degrees of freedomA manufacturer has designed a process to produce pipes that are 10 feet long. The distribution of the pipe length, however, is actually Uniform on the interval 10 feet to 10.57 feet. Assume that the lengths of individual pipes produced by the process are independent. Let X and Y represent the lengths of two different pipes produced by the process.a) What is the joint pdf for X and Y? b) What is the probability that a single pipe will be between 10.07 feet and 10.42 feet long? Give your answer to four decimal places.c) What is the probability that both pieces of pipe are between 10.07 feet and 10.42 feet long? Give your answer to four decimal places. Hint: Try to avoid doing calculus to solve this problem.d) What is the expected length of a single pipe? Give your answer to three decimal places.e) What is the expected total length of the two pieces of pipe? Give your answer to three decimal places.f) What is the variance of the length of a single pipe? Give your answer to four decimal…
- A type of network router has a bandwidth total to first hardware failure called ? expressed in terabytes. The random variable ? is modeled by a distribution whose density is given by one of the following functions: fs(s) = 1/? for s [0,?] with a single parameter ?. Consider the bandwidth total to failure ? of the sequence of the two routers of the same type (one being brought up automatically when the first is broken).Express ? in terms of the bandwidth total to failure of single routers ?1 and ?2. Formulate realistic assumptions about these random variables. Calculate the density function of the variable ?. Given an experiment with the dual-router-system yielding a sample ?1 , ?2 , ..., ?? , calculate the likelihood function for ?. Propose a transformation of this likelihood function whose maximum is the same and can be computed easily. An actual experiment is performed, the infrastructure team has obtained the bandwidth totals to failure given by the sequence ?10 of numbers (225, 22,…Use the F distribution table to find the critical value F0=Let x1,…, xn be the observed values of a ma of size n from the exponential distribution (image 1) If the MLE of beta is (Image 2), obtain the MLE of the probability that the next observation is greater than 1.
- Suppose that the error in the input voltage for a laboratory experiment is a continuous random variable X having the following probability density function : refer to the image belowFind the z-score that has 1.7% of the distribution area to its left.Assume the continuous random variable X has the following cumulative distribution function(c.d.f.): Find the variance of X. Show work and use proper notation.