To compare the dry braking distances from 30 to 0 miles per hour for two makes of automobiles, a safety engineer conducts braking tests for 35 models of Make A and 35 models of Make B. The mean braking distance for Make A is 40 feet. Assume the population standard deviation is 4.9 feet. The mean braking distance for Make B is 44 feet. Assume the population standard deviation is 4.6 feet. At a=0.10, can the engineer support the claim that the mean braking distances are different for the two makes of automobiles? Assume the samples are random and independent, and the populations are normally distributed. Complete parts (a) through (e). Click here to view page 1 of the standard normal distribution table, Click here to view page 2 of the standard normal distribution table. (a) Identify the claim and state Ho and Ha- What is the claim? O A. The mean braking distance is different for the two makes of automobiles. O B. The mean braking distance is less for Make A automobiles than Make B automobiles. OC. The mean braking distance is greater for Make A automobiles than Make B automobiles. O D. The mean braking distance is the same for the two makes of automobiles. What are Ho and H? DA. Ho: H1 SH2 O B. Ho: H1 2 OC. Ho: H1> P2 O D. Ho: H1
To compare the dry braking distances from 30 to 0 miles per hour for two makes of automobiles, a safety engineer conducts braking tests for 35 models of Make A and 35 models of Make B. The mean braking distance for Make A is 40 feet. Assume the population standard deviation is 4.9 feet. The mean braking distance for Make B is 44 feet. Assume the population standard deviation is 4.6 feet. At a=0.10, can the engineer support the claim that the mean braking distances are different for the two makes of automobiles? Assume the samples are random and independent, and the populations are normally distributed. Complete parts (a) through (e). Click here to view page 1 of the standard normal distribution table, Click here to view page 2 of the standard normal distribution table. (a) Identify the claim and state Ho and Ha- What is the claim? O A. The mean braking distance is different for the two makes of automobiles. O B. The mean braking distance is less for Make A automobiles than Make B automobiles. OC. The mean braking distance is greater for Make A automobiles than Make B automobiles. O D. The mean braking distance is the same for the two makes of automobiles. What are Ho and H? DA. Ho: H1 SH2 O B. Ho: H1 2 OC. Ho: H1> P2 O D. Ho: H1

Glencoe Algebra 1, Student Edition, 9780079039897, 0079039898, 2018
18th Edition
ISBN:9780079039897
Author:Carter
Publisher:Carter
Chapter10: Statistics
Section10.5: Comparing Sets Of Data
Problem 13PPS

Related questions
Question
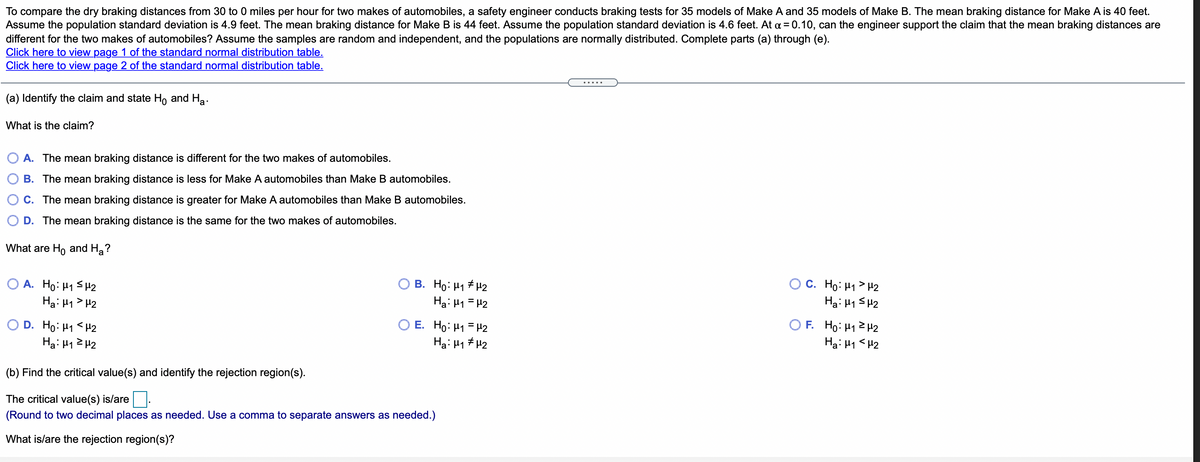
Transcribed Image Text:To compare the dry braking distances from 30 to 0 miles per hour for two makes of automobiles, a safety engineer conducts braking tests for 35 models of Make A and 35 models of Make B. The mean braking distance for Make A is 40 feet.
Assume the population standard deviation is 4.9 feet. The mean braking distance for Make B is 44 feet. Assume the population standard deviation is 4.6 feet. At a = 0.10, can the engineer support the claim that the mean braking distances are
different for the two makes of automobiles? Assume the samples are random and independent, and the populations are normally distributed. Complete parts (a) through (e).
Click here to view page 1 of the standard normal distribution table.
Click here to view page 2 of the standard normal distribution table.
(a) Identify the claim and state H, and Ha.
What is the claim?
A. The mean braking distance is different for the two makes of automobiles.
B. The mean braking distance is less for Make A automobiles than Make B automobiles.
C. The mean braking distance is greater for Make A automobiles than Make B automobiles.
D. The mean braking distance is the same for the two makes of automobiles.
What are Ho and Ha?
O A. Ho: H1 SH2
Ha: H1 > H2
O B. Ho: H1 H2
Ha: H1 = H2
O C. Ho: H1> H2
Ha: H1 SH2
O D. Ho: H1 < H2
Ha: H12 H2
O E. Ho: H1 = H2
Ha: H1 # H2
O F. Ho: H1 2 H2
Ha: H1 <H2
(b) Find the critical value(s) and identify the rejection region(s).
The critical value(s) is/are.
(Round to two decimal places as needed. Use a comma to separate answers as needed.)
What is/are the rejection region(s)?
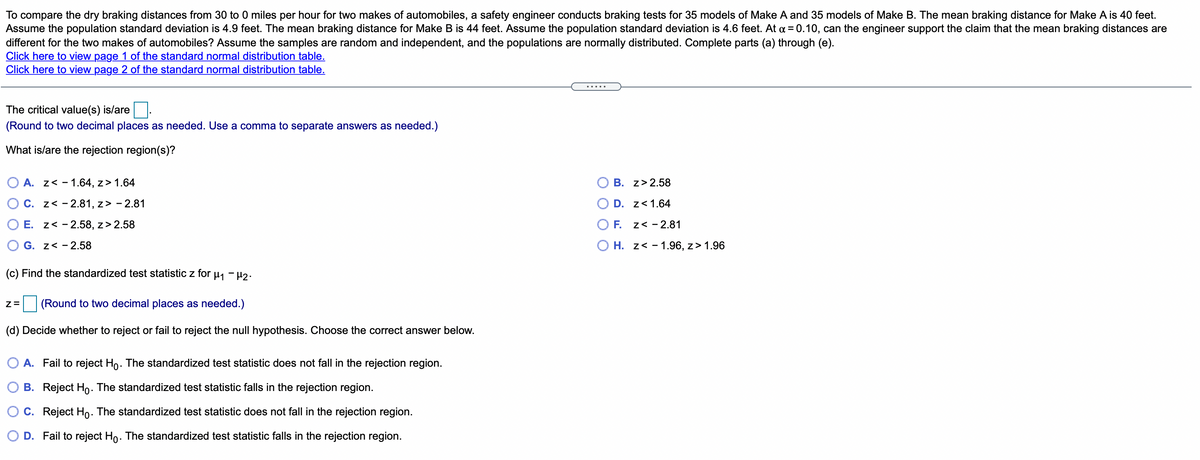
Transcribed Image Text:To compare the dry braking distances from 30 to 0 miles per hour for two makes of automobiles, a safety engineer conducts braking tests for 35 models of Make A and 35 models of Make B. The mean braking distance for Make A is 40 feet.
Assume the population standard deviation is 4.9 feet. The mean braking distance for Make B is 44 feet. Assume the population standard deviation is 4.6 feet. At a = 0.10, can the engineer support the claim that the mean braking distances are
different for the two makes of automobiles? Assume the samples are random and independent, and the populations are normally distributed. Complete parts (a) through (e).
Click here to view page 1 of the standard normal distribution table.
Click here to view page 2 of the standard normal distribution table.
.....
The critical value(s) is/are .
(Round to two decimal places as needed. Use a comma to separate answers as needed.)
What is/are the rejection region(s)?
O A. z< - 1.64, z> 1.64
B. z> 2.58
O C. z< - 2.81, z> - 2.81
D. z<1.64
O E. z< - 2.58, z> 2.58
O F. z< - 2.81
O G. z< -2.58
O H. z< - 1.96, z> 1.96
(c) Find the standardized test statistic z for u, - 42.
(Round to two decimal places as needed.)
(d) Decide whether to reject or fail to reject the null hypothesis. Choose the correct answer below.
O A. Fail to reject Ho. The standardized test statistic does not fall in the rejection region.
O B. Reject Ho. The standardized test statistic falls in the rejection region.
O c. Reject Ho. The standardized test statistic does not fall in the rejection region.
O D. Fail to reject Ho. The standardized test statistic falls in the rejection region.
Expert Solution
This question has been solved!
Explore an expertly crafted, step-by-step solution for a thorough understanding of key concepts.

This is a popular solution!

Trending now
This is a popular solution!

Step by step
Solved in 5 steps with 2 images

Recommended textbooks for you
Glencoe Algebra 1, Student Edition, 9780079039897…
Algebra
ISBN:
9780079039897
Author:
Carter
Publisher:
McGraw Hill
Glencoe Algebra 1, Student Edition, 9780079039897…
Algebra
ISBN:
9780079039897
Author:
Carter
Publisher:
McGraw Hill