To describe the motion of a particle along a straight line, it is often convenient to draw a graph representing the position of the particle at different times. This type of graph is usually referred to as an x vs. t graph. To draw such a graph, choose an axis system in which time t is plotted on the horizontal axis and position a on the vertical axis. Then, indicate the values of x at various times t. Mathematically, this corresponds to plotting the variable a as a function of t. An example of a graph of position as a function of time for a particle traveling along a straight line is shown below. Note that an x vs. t graph like this does not represent the path of the particle in space. Now let's study the graph shown in the figure in more detail. Refer to this graph to answer Parts A, B, and С. x (m) 40 30 20 10 t (s) 50 10 30 40 Part A What is the overall displacement Ax of the particle? Express your answer in meters. • View Available Hint(s) ΑΣΦ ? Ax = m Submit Part B What is the average velocity vay of the particle over the time interval At = 50.0 s ? Express your answer in meters per second. • View Available Hint(s) ? Vav = m/s 20
To describe the motion of a particle along a straight line, it is often convenient to draw a graph representing the position of the particle at different times. This type of graph is usually referred to as an x vs. t graph. To draw such a graph, choose an axis system in which time t is plotted on the horizontal axis and position a on the vertical axis. Then, indicate the values of x at various times t. Mathematically, this corresponds to plotting the variable a as a function of t. An example of a graph of position as a function of time for a particle traveling along a straight line is shown below. Note that an x vs. t graph like this does not represent the path of the particle in space. Now let's study the graph shown in the figure in more detail. Refer to this graph to answer Parts A, B, and С. x (m) 40 30 20 10 t (s) 50 10 30 40 Part A What is the overall displacement Ax of the particle? Express your answer in meters. • View Available Hint(s) ΑΣΦ ? Ax = m Submit Part B What is the average velocity vay of the particle over the time interval At = 50.0 s ? Express your answer in meters per second. • View Available Hint(s) ? Vav = m/s 20

College Physics
10th Edition
ISBN:9781285737027
Author:Raymond A. Serway, Chris Vuille
Publisher:Raymond A. Serway, Chris Vuille
Chapter3: Vectors And Two-Dimensional Motion
Section: Chapter Questions
Problem 42P: This is a symbolic version of Problem 29. A river has a steady speed of vs. A student swims upstream...

Related questions

Question
100%
What's the answer for part A, B, C and D
Transcribed Image Text:Bl 24% 0 9:11 pm
Scores
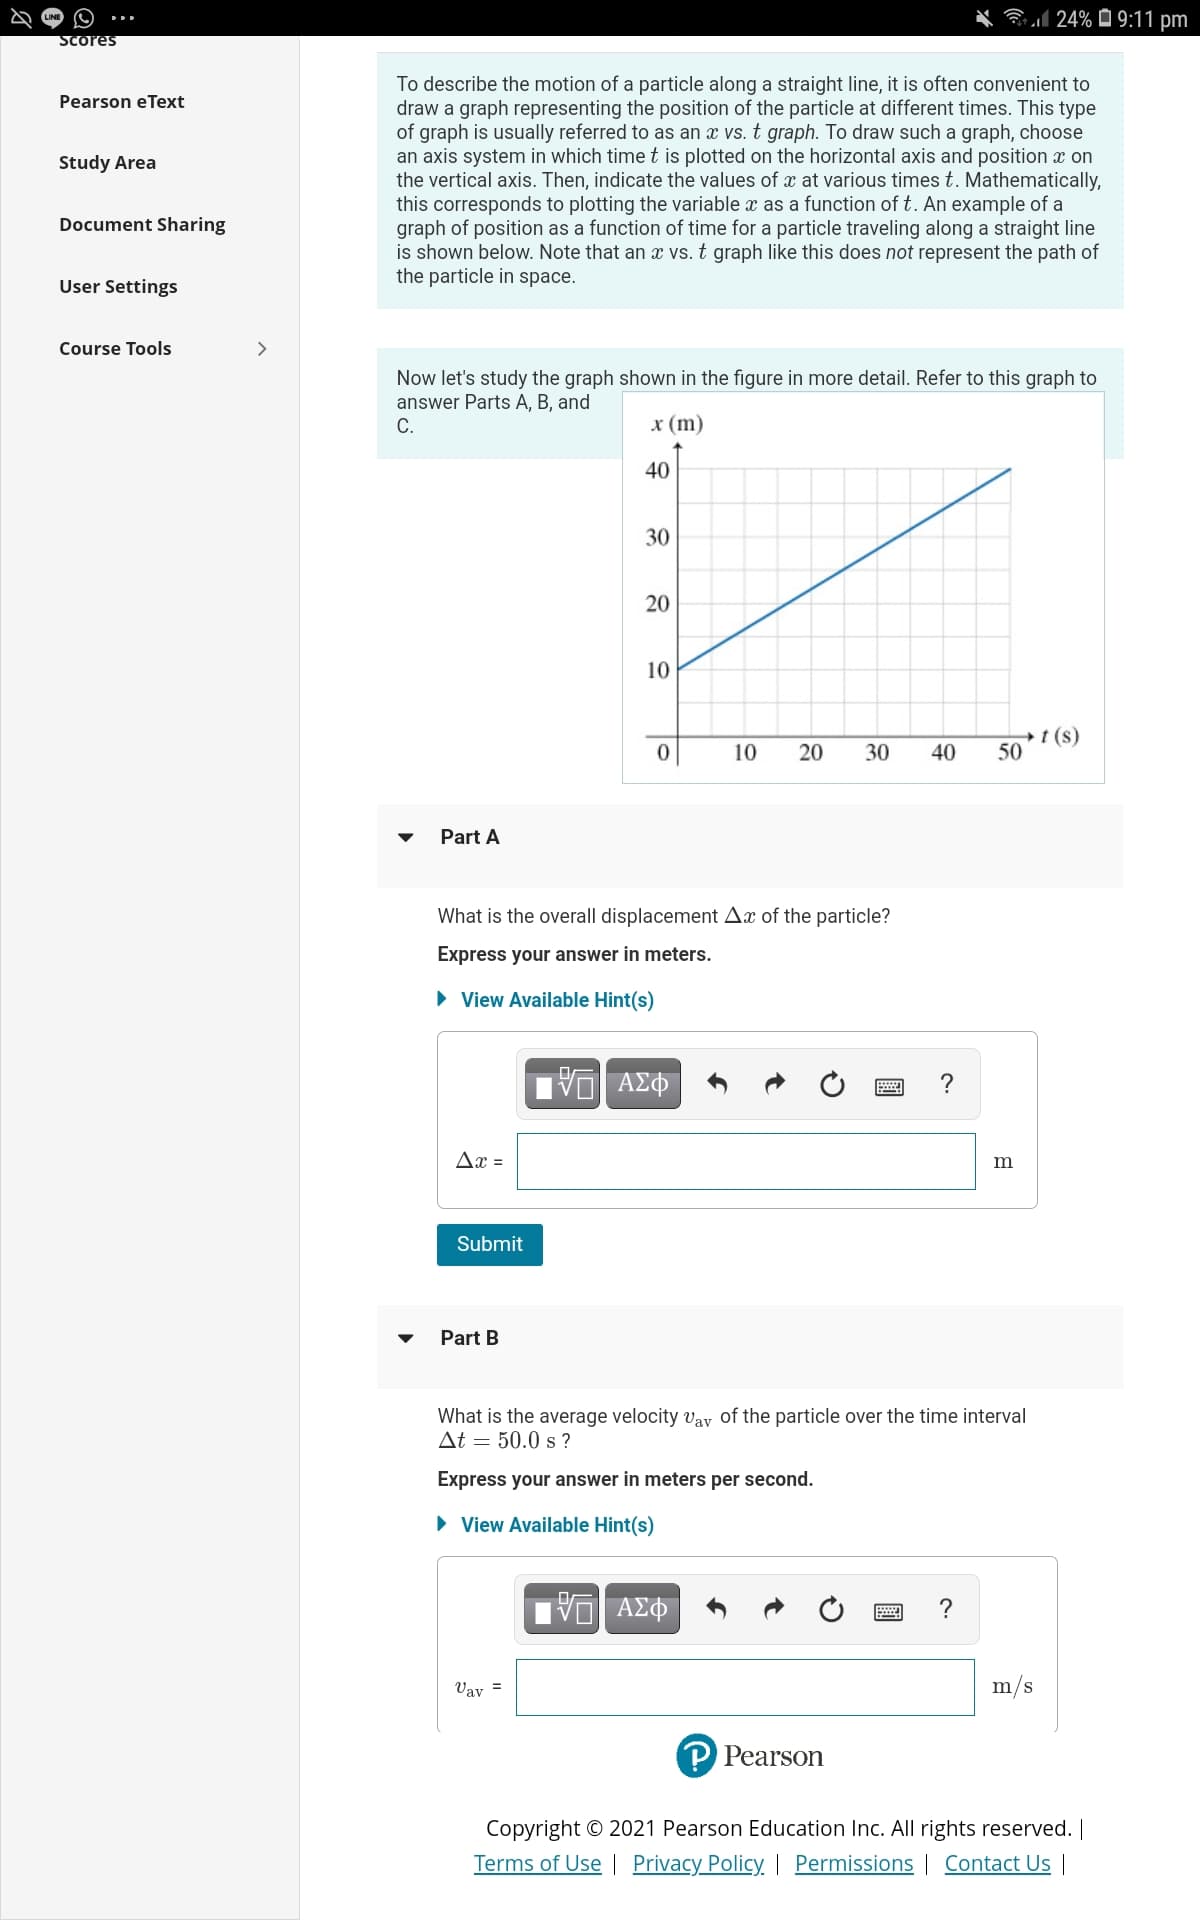
To describe the motion of a particle along a straight line, it is often convenient to
draw a graph representing the position of the particle at different times. This type
of graph is usually referred to as an x vs. t graph. To draw such a graph, choose
an axis system in which timet is plotted on the horizontal axis and position x on
the vertical axis. Then, indicate the values of x at various times t. Mathematically,
this corresponds to plotting the variable x as a function of t. An example of a
graph of position as a function of time for a particle traveling along a straight line
is shown below. Note that an vs. t graph like this does not represent the path of
the particle in space.
Pearson eText
Study Area
Document Sharing
User Settings
Course Tools
>
Now let's study the graph shown in the figure in more detail. Refer to this graph to
answer Parts A, B, and
С.
x (m)
40
30
10
t (s)
50
10
20
30
40
Part A
What is the overall displacement Ax of the particle?
Express your answer in meters.
• View Available Hint(s)
?
Ax =
m
Submit
Part B
What is the average velocity vay of the particle over the time interval
At = 50.0 s ?
Express your answer in meters per second.
• View Available Hint(s)
ν ΑΣΦ
?
Vay =
m/s
P Pearson
Copyright © 2021 Pearson Education Inc. All rights reserved. |
Terms of Use | Privacy Policy | Permissions | Contact Us
20
Transcribed Image Text:Bl 24% Ô 9:12 pm
Submit
Scores
Pearson eText
Part C
Study Area
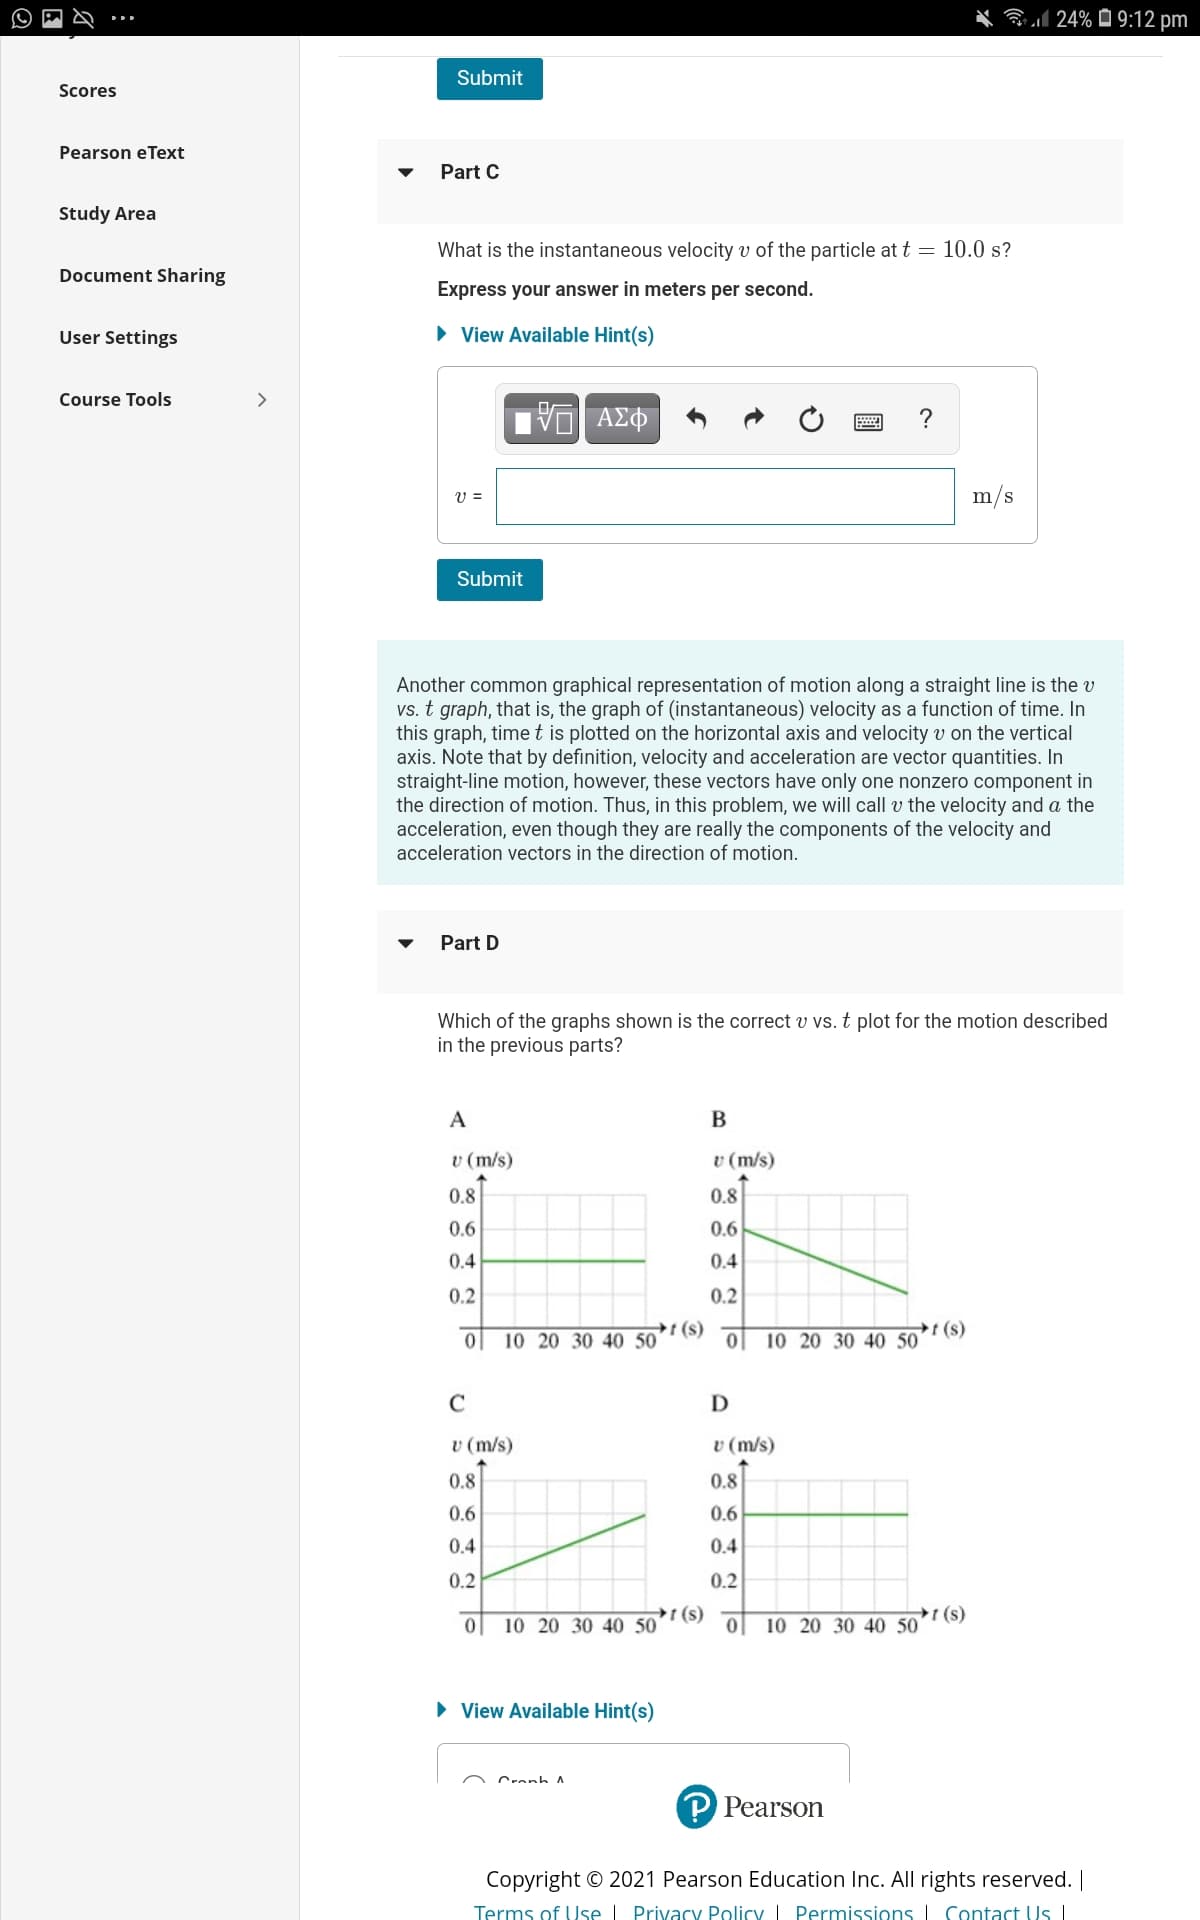
What is the instantaneous velocity v of the particle at t = 10.0 s?
Document Sharing
Express your answer in meters per second.
User Settings
• View Available Hint(s)
Course Tools
>
ν ΑΣΦ
?
V =
m/s
Submit
Another common graphical representation of motion along a straight line is the v
vs. t graph, that is, the graph of (instantaneous) velocity as a function of time. In
this graph, time t is plotted on the horizontal axis and velocity v on the vertical
axis. Note that by definition, velocity and acceleration are vector quantities. In
straight-line motion, however, these vectors have only one nonzero component in
the direction of motion. Thus, in this problem, we will call v the velocity and a the
acceleration, even though they are really the components of the velocity and
acceleration vectors in the direction of motion.
Part D
Which of the graphs shown is the correct v vs. t plot for the motion described
in the previous parts?
A
v (m/s)
v (m/s)
0.8
0.8
0.6
0.6
0.4
0.4
0.2
0.2
t (s)
10 20 30 40 50
t (s)
10 20 30 40 50
C
D
v (m/s)
v (m/s)
0.8
0.8
0.6
0.6
0.4
0.4
0.2
0.2
(s)
10 20 30 40 50
(s)
10 20 30 40 50
• View Available Hint(s)
Cranh
Pearson
Copyright © 2021 Pearson Education Inc. All rights reserved. |
Terms of Use I Privacy Policy Permissions I Contact Us
804
Expert Solution
This question has been solved!
Explore an expertly crafted, step-by-step solution for a thorough understanding of key concepts.

This is a popular solution!

Trending now
This is a popular solution!

Step by step
Solved in 3 steps

Knowledge Booster


Learn more about
Need a deep-dive on the concept behind this application? Look no further. Learn more about this topic, physics and related others by exploring similar questions and additional content below.Recommended textbooks for you
College Physics
Physics
ISBN:
9781285737027
Author:
Raymond A. Serway, Chris Vuille
Publisher:
Cengage Learning

Physics for Scientists and Engineers: Foundations…
Physics
ISBN:
9781133939146
Author:
Katz, Debora M.
Publisher:
Cengage Learning

College Physics
Physics
ISBN:
9781285737027
Author:
Raymond A. Serway, Chris Vuille
Publisher:
Cengage Learning
Physics for Scientists and Engineers: Foundations…
Physics
ISBN:
9781133939146
Author:
Katz, Debora M.
Publisher:
Cengage Learning

Principles of Physics: A Calculus-Based Text
Physics
ISBN:
9781133104261
Author:
Raymond A. Serway, John W. Jewett
Publisher:
Cengage Learning

Physics for Scientists and Engineers
Physics
ISBN:
9781337553278
Author:
Raymond A. Serway, John W. Jewett
Publisher:
Cengage Learning

Physics for Scientists and Engineers with Modern …
Physics
ISBN:
9781337553292
Author:
Raymond A. Serway, John W. Jewett
Publisher:
Cengage Learning