To predict the price of the stock, a model is developed that includes the past behaviour of the stock and also the expectations for the future. The graphical model below shows the past behaviour of the stock price (red graph) and the future expectation (blue graph) over time. Answer the questions below: 10 a) Determine the price of the stock at t=4 based on passed behaviour? Use proper limit notations. b) Determine the price of the stock at t=4 based on future expectations? Use proper limit notations. c) Is the function discontinuous at t=4? How do you know? Use proper limit notations.
To predict the price of the stock, a model is developed that includes the past behaviour of the stock and also the expectations for the future. The graphical model below shows the past behaviour of the stock price (red graph) and the future expectation (blue graph) over time. Answer the questions below: 10 a) Determine the price of the stock at t=4 based on passed behaviour? Use proper limit notations. b) Determine the price of the stock at t=4 based on future expectations? Use proper limit notations. c) Is the function discontinuous at t=4? How do you know? Use proper limit notations.

Algebra & Trigonometry with Analytic Geometry
13th Edition
ISBN:9781133382119
Author:Swokowski
Publisher:Swokowski
Chapter5: Inverse, Exponential, And Logarithmic Functions
Section5.2: Exponential Functions
Problem 71E

Related questions
Question
Transcribed Image Text:Part A: Limits
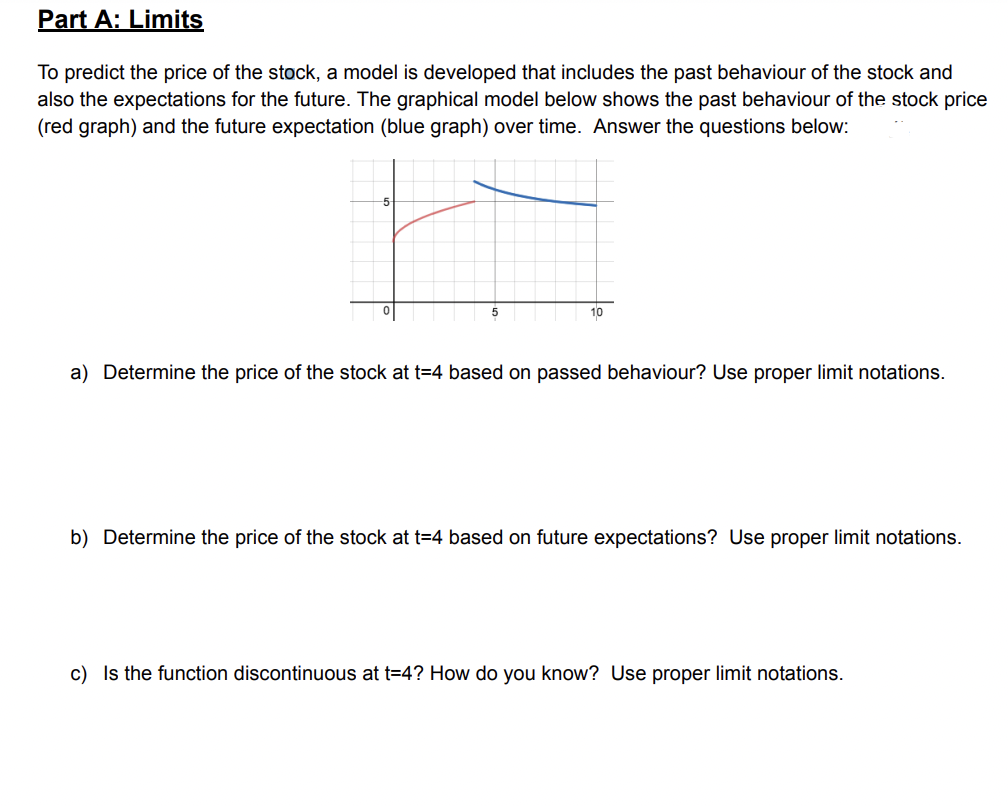
To predict the price of the stock, a model is developed that includes the past behaviour of the stock and
also the expectations for the future. The graphical model below shows the past behaviour of the stock price
(red graph) and the future expectation (blue graph) over time. Answer the questions below:
10
a) Determine the price of the stock at t=4 based on passed behaviour? Use proper limit notations.
b) Determine the price of the stock at t=4 based on future expectations? Use proper limit notations.
c) Is the function discontinuous at t=4? How do you know? Use proper limit notations.
Expert Solution
This question has been solved!
Explore an expertly crafted, step-by-step solution for a thorough understanding of key concepts.

Step by step
Solved in 4 steps with 4 images

Recommended textbooks for you
Algebra & Trigonometry with Analytic Geometry
Algebra
ISBN:
9781133382119
Author:
Swokowski
Publisher:
Cengage
Algebra & Trigonometry with Analytic Geometry
Algebra
ISBN:
9781133382119
Author:
Swokowski
Publisher:
Cengage