To set up a simulation for this situation, we let each new strain dogwood tree be represented with a card. To set up the null hypothesis model, we tak 100 cards, green cards to represent seedlings that die within 3 years and white cards to represent seedlings that do not. Shuffle the cards and draw cards with replacement representing the sample in the researcher's study. Record the proportion of ? v cards and call it Pm Repeat this 3,000 times and plot the resulting sample proportions to construct the null distribution. 3. Notice that Martin's observed proportion is 5% from the center of the null distribution. Suppose you use computer technology to simulate results under the null hypothesis. After 3000 simulations, you find that: • 535 of the 3000 simulations fell more than 5% below the center of the null distribution, and • 538 of the 3000 simulations fell more than 5% above the center of the null distribution. Use the results of the simulation to calculate the p-value.
To set up a simulation for this situation, we let each new strain dogwood tree be represented with a card. To set up the null hypothesis model, we tak 100 cards, green cards to represent seedlings that die within 3 years and white cards to represent seedlings that do not. Shuffle the cards and draw cards with replacement representing the sample in the researcher's study. Record the proportion of ? v cards and call it Pm Repeat this 3,000 times and plot the resulting sample proportions to construct the null distribution. 3. Notice that Martin's observed proportion is 5% from the center of the null distribution. Suppose you use computer technology to simulate results under the null hypothesis. After 3000 simulations, you find that: • 535 of the 3000 simulations fell more than 5% below the center of the null distribution, and • 538 of the 3000 simulations fell more than 5% above the center of the null distribution. Use the results of the simulation to calculate the p-value.

Functions and Change: A Modeling Approach to College Algebra (MindTap Course List)
6th Edition
ISBN:9781337111348
Author:Bruce Crauder, Benny Evans, Alan Noell
Publisher:Bruce Crauder, Benny Evans, Alan Noell
Chapter5: A Survey Of Other Common Functions
Section5.6: Higher-degree Polynomials And Rational Functions
Problem 5E: Population Genetics In the study of population genetics, an important measure of inbreeding is the...

Related questions
Question
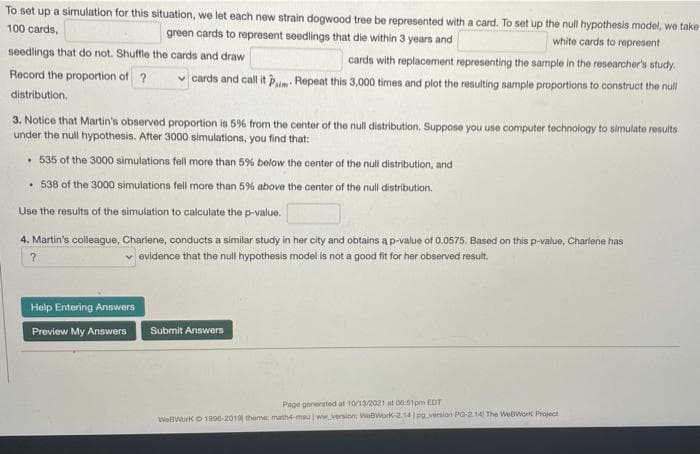
Transcribed Image Text:To set up a simulation for this situation, we let each new strain dogwood tree be represented with a card. To set up the null hypothesis model, we take
100 cards,
green cards to represent seedlings that die within 3 years and
white cards to represent
seedlings that do not. Shuffle the cards and draw
cards with replacement representing the sample in the researcher's study.
Record the proportion of ?
v cards and call it pim Repeat this 3,000 times and plot the resulting sample proportions to construct the null
distribution.
3. Notice that Martin's observed proportion is 5% from the center of the null distribution. Suppose you use computer technology to simulate results
under the null hypothesis. After 3000 simulations, you find that:
• 535 of the 3000 simulations fell more than 5% below the center of the nuli distribution, and
• 538 of the 3000 simulations fell more than 5% above the center of the null distribution.
Use the results of the simulation to calculate the p-value.
4. Martin's colleague, Charlene, conducts a similar study in her city and obtains ap-value of 0.0575. Based on this p-value, Charlene has
v evidence that the null hypothesis model is not a good fit for her observed result.
Help Entering Answers
Preview My Answers
Submit Answers
Page penerated at 10/13/2021 at 0051pm EDT
WoBWorko 1996-2010 theme math4-mu ww.version: WeBWork-2.14 pg.version PG-214 The WelWork Project
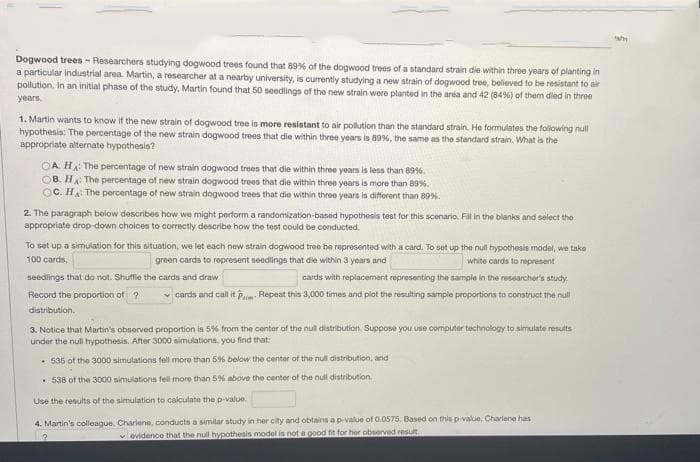
Transcribed Image Text:Dogwood trees - Researchers studying dogwood trees found that 89% of the dogwood trees of a standard strain die within three years of planting in
a particular industrial area. Martin, a researcher at a nearby university, is currently studying a new strain of dogwood tree, believed to be resistant to air
pollution. In an initial phase of the study, Martin found that 50 seedlings of the new strain were planted in the area and 42 (84%) of them died in three
years.
1. Martin wants to know it the new strain of dogwood tree is more resistant to air pollution than the standard strain. He formulates the following null
hypothesis: The percentage of the new strain dogwood trees that die within three years is 89%, the same as the standard strain. What is the
appropriate alternate hypothesis?
OA. HA The percentage of new strain dogwood trees that die within three years is less than 89%.
OB. HA The percentage of new strain dogwood trees that die within three years is more than 89%.
OC. HA The percentage of new strain dogwood trees that die within three years is different than 89%.
2. The paragraph below describes how we might perform a randomization-based hypothesis test for this scenario. Fill in the blanks and select the
appropriate drop-down choices to correctly describe how the test could be conducted.
To set up a simulation for this situation, we let each new strain dogwood tree be represented with a card. To set up the null hypothesis model, we take
100 cards,
green cards to represent seedlings that die within 3 years and
white cards to represent
seedings that do not. Shuffle the cards and draw
cards with replacement represeriting the sample in the researcher's study.
Record the proportion of ?
v cards and call it Pm Repeat this 3,000 times and plot the resulting sample proportions to construct the null
distribution.
3. Notice that Martin's observed proportion is 5% from the center of the nul distribution. Suppose you use computer technology to simulate results
under the null hypothesis. After 3000 simulations, you find that:
• 535 ot the 3000 simulations fell more than 59% below the center of the null distribution, and
• 538 of the 3000 simulations fell more than 5% above the centor of the null distribution.
Use the results of the simulation to calculate the p-value.
4. Martin's colleague. Charlene, conducts a similar study in her city and obtains ap-value of 0.0575. Based on this p-value, Charlene has
vevidence that the null hypothesis model is not a good fit for her observed resut.
Expert Solution
This question has been solved!
Explore an expertly crafted, step-by-step solution for a thorough understanding of key concepts.

This is a popular solution!

Trending now
This is a popular solution!

Step by step
Solved in 3 steps

Recommended textbooks for you
Functions and Change: A Modeling Approach to Coll…
Algebra
ISBN:
9781337111348
Author:
Bruce Crauder, Benny Evans, Alan Noell
Publisher:
Cengage Learning

Holt Mcdougal Larson Pre-algebra: Student Edition…
Algebra
ISBN:
9780547587776
Author:
HOLT MCDOUGAL
Publisher:
HOLT MCDOUGAL

Algebra & Trigonometry with Analytic Geometry
Algebra
ISBN:
9781133382119
Author:
Swokowski
Publisher:
Cengage
Functions and Change: A Modeling Approach to Coll…
Algebra
ISBN:
9781337111348
Author:
Bruce Crauder, Benny Evans, Alan Noell
Publisher:
Cengage Learning
Holt Mcdougal Larson Pre-algebra: Student Edition…
Algebra
ISBN:
9780547587776
Author:
HOLT MCDOUGAL
Publisher:
HOLT MCDOUGAL
Algebra & Trigonometry with Analytic Geometry
Algebra
ISBN:
9781133382119
Author:
Swokowski
Publisher:
Cengage