Tollowin naspa ŷ = 17.6 + 3.8x, - 2.3x, + 7.6x3 + 2.7x4 The values of SST and SSR are 1,803 and 1,756, respectively. (a) Compute R2. (Round your answer to three decimal places.) R2 = (b) Compute R,. (Round your answer to three decimal places.) R2 (c) Comment on the goodness of fit. (For purposes of this exercise, consider a proportion large if it is at least 0.55.) O The estimated regression equation provided a good fit as a small proportion of the variability in y has been explained by the estimated regression equation. O The estimated regression equation did not provide a good fit as a small proportion of the variability in y has been explained by the estimated regression equation. O The estimated regression equation did not provide a good fit as a large proportion of the variability in y has been explained by the estimated regression equation. O The estimated regression equation provided a good fit as a large proportion of the variability in v has been explained by the estimated regression equation.
Tollowin naspa ŷ = 17.6 + 3.8x, - 2.3x, + 7.6x3 + 2.7x4 The values of SST and SSR are 1,803 and 1,756, respectively. (a) Compute R2. (Round your answer to three decimal places.) R2 = (b) Compute R,. (Round your answer to three decimal places.) R2 (c) Comment on the goodness of fit. (For purposes of this exercise, consider a proportion large if it is at least 0.55.) O The estimated regression equation provided a good fit as a small proportion of the variability in y has been explained by the estimated regression equation. O The estimated regression equation did not provide a good fit as a small proportion of the variability in y has been explained by the estimated regression equation. O The estimated regression equation did not provide a good fit as a large proportion of the variability in y has been explained by the estimated regression equation. O The estimated regression equation provided a good fit as a large proportion of the variability in v has been explained by the estimated regression equation.

College Algebra
7th Edition
ISBN:9781305115545
Author:James Stewart, Lothar Redlin, Saleem Watson
Publisher:James Stewart, Lothar Redlin, Saleem Watson
Chapter1: Equations And Graphs
Section: Chapter Questions
Problem 10T: Olympic Pole Vault The graph in Figure 7 indicates that in recent years the winning Olympic men’s...

Related questions
Question
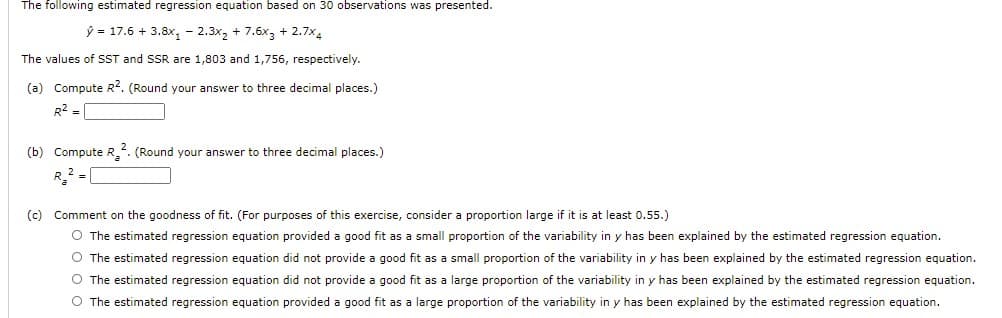
Transcribed Image Text:The following estimated regression equation based on 30 observations was presented.
ý = 17.6 + 3.8x, - 2.3x2 + 7.6x3 + 2.7x4
The values of SST and SSR are 1,803 and 1,756, respectively.
(a) Compute R2. (Round your answer to three decimal places.)
R2 =
(b) Compute R2. (Round your answer to three decimal places.)
(c) Comment on the goodness of fit. (For purposes of this exercise, consider a proportion large if it is
least 0.55.)
O The estimated regression equation provided a good fit as a small proportion of the variability in y has been explained by the estimated regression equation.
O The estimated regression equation did not provide a good fit as a small proportion of the variability in y has been explained by the estimated regression equation.
O The estimated regression equation did not provide a good fit as a large proportion of the variability in y has been explained by the estimated regression equation.
O The estimated regression equation provided a good fit as a large proportion of the variability in y has been explained by the estimated regression equation.
Expert Solution
This question has been solved!
Explore an expertly crafted, step-by-step solution for a thorough understanding of key concepts.

This is a popular solution!

Trending now
This is a popular solution!

Step by step
Solved in 3 steps with 1 images

Knowledge Booster


Learn more about
Need a deep-dive on the concept behind this application? Look no further. Learn more about this topic, statistics and related others by exploring similar questions and additional content below.Recommended textbooks for you
College Algebra
Algebra
ISBN:
9781305115545
Author:
James Stewart, Lothar Redlin, Saleem Watson
Publisher:
Cengage Learning

Algebra and Trigonometry (MindTap Course List)
Algebra
ISBN:
9781305071742
Author:
James Stewart, Lothar Redlin, Saleem Watson
Publisher:
Cengage Learning

Functions and Change: A Modeling Approach to Coll…
Algebra
ISBN:
9781337111348
Author:
Bruce Crauder, Benny Evans, Alan Noell
Publisher:
Cengage Learning
College Algebra
Algebra
ISBN:
9781305115545
Author:
James Stewart, Lothar Redlin, Saleem Watson
Publisher:
Cengage Learning
Algebra and Trigonometry (MindTap Course List)
Algebra
ISBN:
9781305071742
Author:
James Stewart, Lothar Redlin, Saleem Watson
Publisher:
Cengage Learning
Functions and Change: A Modeling Approach to Coll…
Algebra
ISBN:
9781337111348
Author:
Bruce Crauder, Benny Evans, Alan Noell
Publisher:
Cengage Learning