Topic: Mean and Variance of Discrete Random Variable and the Characteristics of Normal Random Variable Example 1: Suppose that you are given the option of two investment portfolios, A and B, with potential profits and the associated probabilities displayed below. PORT Profit ORTFOLIO B Probablity P(x) 0.3 0.1 0.3 0.3 Profit Probability -2,000 4,000 3,000 5,000 Calculated Mean and Standard Deviation for Portfolio A: Calculated Mean and Standard Deviation for Portfolo B: P(x) 0.2 0.2 0.4 0.2 -3,000 -2,000 4,000 5,000 p-1,400 and o = 3,322.65 1,600 and o = 3,882.31 A Using the mean and variance of Portfollo A, interpret the result.2022/378 15:05 B. Based on the expected profits, which portfolio will you choose?
Topic: Mean and Variance of Discrete Random Variable and the Characteristics of Normal Random Variable Example 1: Suppose that you are given the option of two investment portfolios, A and B, with potential profits and the associated probabilities displayed below. PORT Profit ORTFOLIO B Probablity P(x) 0.3 0.1 0.3 0.3 Profit Probability -2,000 4,000 3,000 5,000 Calculated Mean and Standard Deviation for Portfolio A: Calculated Mean and Standard Deviation for Portfolo B: P(x) 0.2 0.2 0.4 0.2 -3,000 -2,000 4,000 5,000 p-1,400 and o = 3,322.65 1,600 and o = 3,882.31 A Using the mean and variance of Portfollo A, interpret the result.2022/378 15:05 B. Based on the expected profits, which portfolio will you choose?

Chapter8: Risk And Rates Of Return
Section: Chapter Questions
Problem 9PROB

Related questions

Question
Mean and Variance of Discrete Random Variable and the Characteristics of Normal Random
Variable
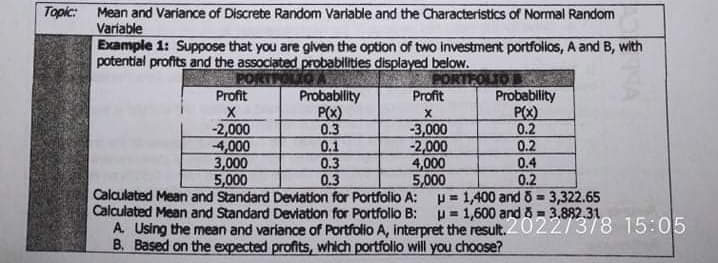
Example 1: Suppose that you are given the option of two investment portfolios, A and B, with potential profits and the associated probabilities displayed below.
PORTFOLIO A
Profit X
-2,000
-4,000
3,000
5,000
PROBABILITY P(x)
0.3
0.1
0.3
0.3
PORTFOLIO B
Profit X
-3,000
-2,000
4,000
5,000
Probability P(X)
0.2
0.2
0.4
0.2
Calculated Mean and Standard Deviation for Portrollo A:
Mean = 1,400 and standard deviation = 3,322.65
Calculated Mean and Standard Deviation for Portrollo B:
Mean=1,600 and standard deviation= 3,882.31
A. using the mean and variance of portfolio A, interpret the result
B.Based on the expected profits, which portfolio will you choose?
Transcribed Image Text:Topic:
Mean and Variance of Discrete Random Variable and the Characteristics of Normal Random
Variable
Example 1: Suppose that you are given the option of two investment portfolios, A and B, with
potential profits and the associated probabilities displayed below.
PORTPOLIO
Profit
Probablity
P(x)
0.3
0.1
0.3
0.3
Calculated Mean and Standard Deviation for Portfolio A: p= 1,400 and 6 = 3,322.65
ORTFOLIO
Probablity
P(X)
0.2
0.2
0.4
Profit
-2,000
4,000
3,000
5,000
-3,000
-2,000
4,000
5,000
0.2
!3!
%3D
Calculated Mean and Standard Deviation for Portfollo B:
A. Using the mean and variance of Portfolo A, interpret the result.20227378 15:05
p= 1,600 and 8= 3.882.31
%3!
B. Based on the expected profits, which portfolio will you choose?
Expert Solution
This question has been solved!
Explore an expertly crafted, step-by-step solution for a thorough understanding of key concepts.

Step by step
Solved in 6 steps

Knowledge Booster


Learn more about
Need a deep-dive on the concept behind this application? Look no further. Learn more about this topic, finance and related others by exploring similar questions and additional content below.Recommended textbooks for you

EBK CONTEMPORARY FINANCIAL MANAGEMENT
Finance
ISBN:
9781337514835
Author:
MOYER
Publisher:
CENGAGE LEARNING - CONSIGNMENT

EBK CONTEMPORARY FINANCIAL MANAGEMENT
Finance
ISBN:
9781337514835
Author:
MOYER
Publisher:
CENGAGE LEARNING - CONSIGNMENT

Intermediate Financial Management (MindTap Course…
Finance
ISBN:
9781337395083
Author:
Eugene F. Brigham, Phillip R. Daves
Publisher:
Cengage Learning
