Tutorial Exercise The annual net income of a company for the period 2007-2011 could be approximated by P(t) = 1.6t? – 15t + 45 billion dollars (2 sts 6), where t is the time in years since the start of 2005. According to the model, during what year in this period was the company's net income the lowest? What was the corresponding net income? Would you trust this model to continue to be valid long past this period? Why or why not? Step 1 The annual net income of a company for the time period 2007–2011 is given by the quadratic function P(t) = 1.6t? - 15t + 45 billion dollars, where the inputs for t are 2sts 6. We are looking for the time t for which the company's net income was the lowest. Notice that the income function is a quadratic function of the form P(t) = at? + bt + c, where a = parabola. The graph of a parabola is called concave up if a > 0, in which case the parabola opens upward. The graph of a parabola is called concave down if a < 0, in which case the parabola opens downward. In this case, because a is --Select--- v , the parabola is concave --Select--- v. So the lowest point on the parabola is the ,b = , and c = ]. The graph of the quadratic function is a vertex.
Tutorial Exercise The annual net income of a company for the period 2007-2011 could be approximated by P(t) = 1.6t? – 15t + 45 billion dollars (2 sts 6), where t is the time in years since the start of 2005. According to the model, during what year in this period was the company's net income the lowest? What was the corresponding net income? Would you trust this model to continue to be valid long past this period? Why or why not? Step 1 The annual net income of a company for the time period 2007–2011 is given by the quadratic function P(t) = 1.6t? - 15t + 45 billion dollars, where the inputs for t are 2sts 6. We are looking for the time t for which the company's net income was the lowest. Notice that the income function is a quadratic function of the form P(t) = at? + bt + c, where a = parabola. The graph of a parabola is called concave up if a > 0, in which case the parabola opens upward. The graph of a parabola is called concave down if a < 0, in which case the parabola opens downward. In this case, because a is --Select--- v , the parabola is concave --Select--- v. So the lowest point on the parabola is the ,b = , and c = ]. The graph of the quadratic function is a vertex.

Algebra & Trigonometry with Analytic Geometry
13th Edition
ISBN:9781133382119
Author:Swokowski
Publisher:Swokowski
Chapter3: Functions And Graphs
Section: Chapter Questions
Problem 7DE

Related questions
Question
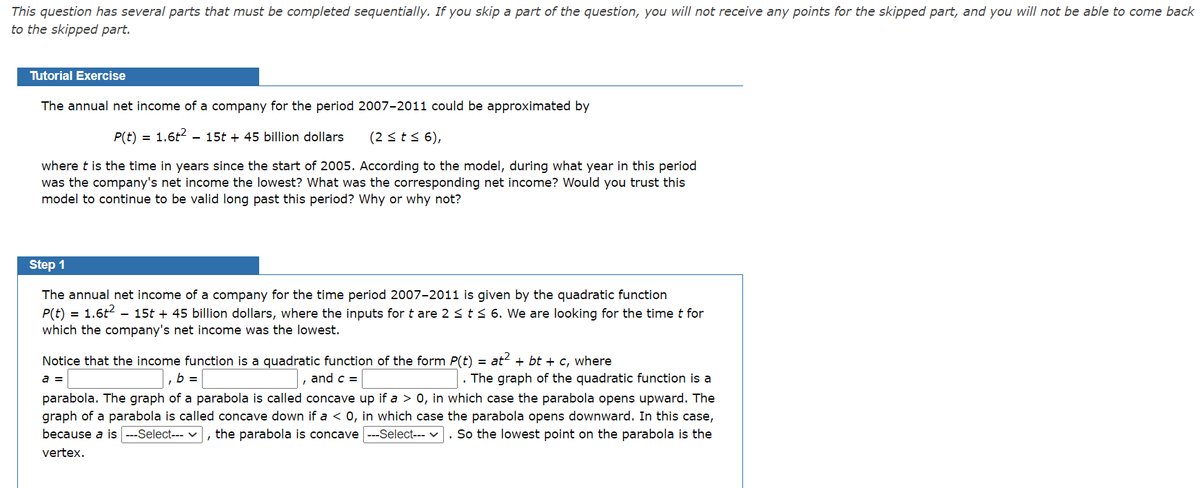
Transcribed Image Text:This question has several parts that must be completed sequentially. If you skip a part of the question, you will not receive any points for the skipped part, and you will not be able to come back
to the skipped part.
Tutorial Exercise
The annual net income of a company for the period 2007-2011 could be approximated by
P(t)
1.6t2
- 15t + 45 billion dollars
(2 <t< 6),
where t is the time in years since the start of 2005. According to the model, during what year in this period
was the company's net income the lowest? What was the corresponding net income? Would you trust this
model to continue to be valid long past this period? Why or why not?
Step 1
The annual net income of a company for the time period 2007-2011 is given by the quadratic function
P(t) = 1.6t2
which the company's net income was the lowest.
- 15t + 45 billion dollars, where the inputs for t are 2 st< 6. We are looking for the time t for
Notice that the income function is a quadratic function of the form P(t) =
at? + bt + c, where
. The graph of the quadratic function is a
parabola. The graph of a parabola is called concave up if a > 0, in which case the parabola opens upward. The
graph of a parabola is called concave down if a < 0, in which case the parabola opens downward. In this case,
because a is ---Select--- v, the parabola is concave ---Select--- v. So the lowest point on the parabola is the
a =
b =
and c =
vertex.
Expert Solution
This question has been solved!
Explore an expertly crafted, step-by-step solution for a thorough understanding of key concepts.

Step by step
Solved in 2 steps with 1 images

Knowledge Booster


Learn more about
Need a deep-dive on the concept behind this application? Look no further. Learn more about this topic, calculus and related others by exploring similar questions and additional content below.Recommended textbooks for you
Algebra & Trigonometry with Analytic Geometry
Algebra
ISBN:
9781133382119
Author:
Swokowski
Publisher:
Cengage

College Algebra (MindTap Course List)
Algebra
ISBN:
9781305652231
Author:
R. David Gustafson, Jeff Hughes
Publisher:
Cengage Learning

Glencoe Algebra 1, Student Edition, 9780079039897…
Algebra
ISBN:
9780079039897
Author:
Carter
Publisher:
McGraw Hill
Algebra & Trigonometry with Analytic Geometry
Algebra
ISBN:
9781133382119
Author:
Swokowski
Publisher:
Cengage
College Algebra (MindTap Course List)
Algebra
ISBN:
9781305652231
Author:
R. David Gustafson, Jeff Hughes
Publisher:
Cengage Learning
Glencoe Algebra 1, Student Edition, 9780079039897…
Algebra
ISBN:
9780079039897
Author:
Carter
Publisher:
McGraw Hill


Algebra: Structure And Method, Book 1
Algebra
ISBN:
9780395977224
Author:
Richard G. Brown, Mary P. Dolciani, Robert H. Sorgenfrey, William L. Cole
Publisher:
McDougal Littell
