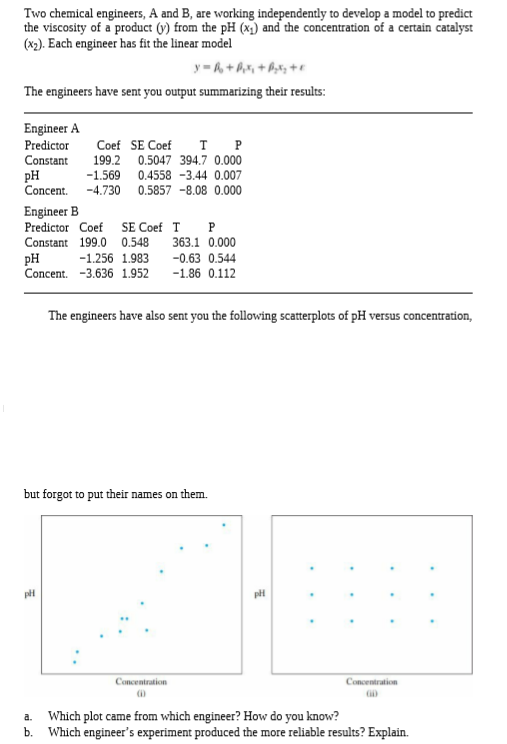
Two chemical engineers, A and B, are working independently to develop a model to predict the viscosity of a product (y) from the pH (x1) and the concentration of a certain catalyst (x2). Each engineer has fit the linear model y =A +hr, + B;x; +r The engineers have sent you output summarizing their results: Engineer A Predictor Constant тР Coef SE Coef 199.2 0.5047 394.7 0.000 -1.569 pH Concent. -4.730 0.5857 -8.08 0.000 0.4558 -3.44 0.007 Engineer B Predictor Coef Constant 199.0 0.548 SE Coef T 363.1 0.000 pH Concent. -3.636 1.952 -1.256 1.983 -0.63 0.544 -1.86 0.112 The engineers have also sent you the following scatterplots of pH versus concentration, but forgot to put their names on them. Concentration Concentration Which plot came from which engineer? How do you know? Which engineer's experiment produced the more reliable results? Explain. a. b.
Two chemical engineers, A and B, are working independently to develop a model to predict the viscosity of a product (y) from the pH (x1) and the concentration of a certain catalyst (x2). Each engineer has fit the linear model y =A +hr, + B;x; +r The engineers have sent you output summarizing their results: Engineer A Predictor Constant тР Coef SE Coef 199.2 0.5047 394.7 0.000 -1.569 pH Concent. -4.730 0.5857 -8.08 0.000 0.4558 -3.44 0.007 Engineer B Predictor Coef Constant 199.0 0.548 SE Coef T 363.1 0.000 pH Concent. -3.636 1.952 -1.256 1.983 -0.63 0.544 -1.86 0.112 The engineers have also sent you the following scatterplots of pH versus concentration, but forgot to put their names on them. Concentration Concentration Which plot came from which engineer? How do you know? Which engineer's experiment produced the more reliable results? Explain. a. b.

Algebra for College Students
10th Edition
ISBN:9781285195780
Author:Jerome E. Kaufmann, Karen L. Schwitters
Publisher:Jerome E. Kaufmann, Karen L. Schwitters
Chapter12: Algebra Of Matrices
Section12.CR: Review Problem Set
Problem 37CR

Related questions
Question
Transcribed Image Text:Two chemical engineers, A and B, are working independently to develop a model to predict
the viscosity of a product (y) from the pH (x1) and the concentration of a certain catalyst
(x2). Each engineer has fit the linear model
y =A +hr, + B;x; +r
The engineers have sent you output summarizing their results:
Engineer A
Predictor
Constant
тР
Coef SE Coef
199.2 0.5047 394.7 0.000
-1.569
pH
Concent. -4.730 0.5857 -8.08 0.000
0.4558 -3.44 0.007
Engineer B
Predictor Coef
Constant 199.0 0.548
SE Coef T
363.1 0.000
pH
Concent. -3.636 1.952
-1.256 1.983
-0.63 0.544
-1.86 0.112
The engineers have also sent you the following scatterplots of pH versus concentration,
but forgot to put their names on them.
Concentration
Concentration
Which plot came from which engineer? How do you know?
Which engineer's experiment produced the more reliable results? Explain.
a.
b.
Expert Solution
This question has been solved!
Explore an expertly crafted, step-by-step solution for a thorough understanding of key concepts.

This is a popular solution!

Trending now
This is a popular solution!

Step by step
Solved in 3 steps

Recommended textbooks for you
Algebra for College Students
Algebra
ISBN:
9781285195780
Author:
Jerome E. Kaufmann, Karen L. Schwitters
Publisher:
Cengage Learning

Linear Algebra: A Modern Introduction
Algebra
ISBN:
9781285463247
Author:
David Poole
Publisher:
Cengage Learning

Algebra & Trigonometry with Analytic Geometry
Algebra
ISBN:
9781133382119
Author:
Swokowski
Publisher:
Cengage
Algebra for College Students
Algebra
ISBN:
9781285195780
Author:
Jerome E. Kaufmann, Karen L. Schwitters
Publisher:
Cengage Learning
Linear Algebra: A Modern Introduction
Algebra
ISBN:
9781285463247
Author:
David Poole
Publisher:
Cengage Learning
Algebra & Trigonometry with Analytic Geometry
Algebra
ISBN:
9781133382119
Author:
Swokowski
Publisher:
Cengage