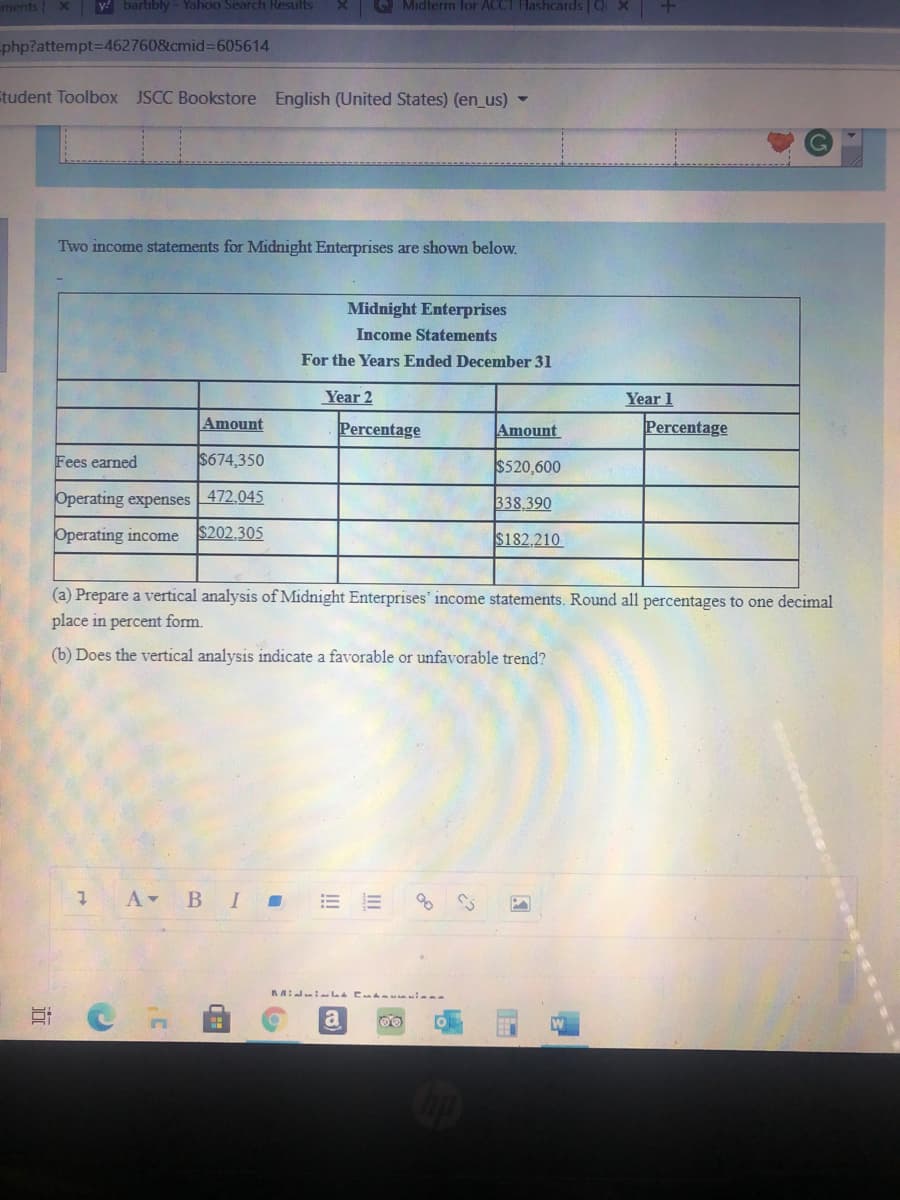
Two income statements for Midnight Enterprises are shown below. Midnight Enterprises Income Statements For the Years Ended December 31 Year 2 Year 1 Amount Percentage Amount Percentage Fees earned $674,350 $520,600 Operating expenses 472.045 338.390 Operating income $202,305 $182,210 (a) Prepare a vertical analysis of Midnight Enterprises' income statements. Round all percentages to one decimal place in percent form. (b) Does the vertical analysis indicate a favorable or unfavorable trend?
Q: Prepare a comparative common-size income statement for Jubilee Corporation. To an investor, how does…
A: Comparative analysis is used to measure the performance of the organization. It helps for the…
Q: A company reports the following income statement and balance sheet information for current year: Net…
A: Return on total assets means how much the total assets is able to give in return. The computation of…
Q: orizontal Analysis of Income Statement The following data (in millions) were taken from the…
A: horizontal analysis is the review of the financial statements of the company, over different…
Q: A company reports the following income statement and balance sheet information for the current year:…
A: Formula: Return on Total Assets = ( Net Income + Interest expense ) / Average Total Assets Average…
Q: A company reports the following income statement and balance sheet information for current year: Net…
A: Theory concept: Return on Assets : It tells the net income earned on total assets used by the…
Q: Prepare a horizontal analysis of Vaughn Company's income statements. Use the minus sign to indicate…
A: Horizontal analysis is used to analyze financial statements which states that how much amount and…
Q: A company reports the following income statement and balance sheet information for the current year:…
A: Formula: Return on total Assets = ( Net income + Interest expense ) / Average total Assets
Q: Return on Total Assets A company reports the following income statement and balance sheet…
A: Return on total assets shows the firm's ability to use the total assets to generate expected…
Q: What is the company's times interest earned ratio?
A: Information Provided: Income before provision for income taxes = $1,025,959 Interest expense =…
Q: Two income statements for Satterfield Company are shown below. Satterfield Company Income…
A: The comparison in different year financial statement can be made on the basis of increase or…
Q: 20Y2 Amount 20Y2 Percent 20Y1 Amount 20Y1 Percent Sales $1,300,000 fill in the blank…
A: A comparative statement is a statement which contains information from several incomes statement. It…
Q: Vertical Analysis Revenue and expense data for Innovation Quarter Inc. for two recent years are as…
A: The income statement is prepared to estimate the net income or loss incurred during the period.
Q: Horizontal Analysis of Income Statement The following data (in millions) were taken from the…
A: Horizontal Analysis: It is possible to do a horizontal analysis of financial statements by comparing…
Q: Income statement data for Winthrop Company for two recent years ended December 31 are as follows:…
A: (a)
Q: Belnap Company has provided the following partial comparative balance sheets and the income…
A: Definition: Statement of cash flows: This statement reports all the cash transactions which are…
Q: Two income statements for Versatile Company follow: Versatile Company Income Statements For the…
A: Note: Since you have posted multiple questions, we will solve the first question. Please submit a…
Q: Revenue and expense data for Young Technologies Inc. are as follows: Year 2 Year 1 Sales $500,000…
A: Vertical analysis: The comparison of an item of a financial statement against the total amount of…
Q: he balance sheet data of Randolph Company for two recent years appears below: Assets: Year 2 Year…
A: Horizontal analysis is prepared to calculate the variance from previous year by showing…
Q: Income Statement Goldfinger Corporation had account balances at the end of the current year as…
A: This question deals with the preparation of income statement. Income statement are prepared by the…
Q: UUsing the following income statements, perform the calculations needed for horizontal analyses.…
A: Financial statements can be examined utilizing: (1) Horizontal analysis and (2) Verticle analysis In…
Q: Two income statements for Satterfield Company are shown below. Satterfield Company Income Statements…
A: Income statement: It is one of the financial statements prepared by an organization. This statement…
Q: Norton Company Income Statement For Year Ended December 31 1 Common stock, $50 par $200,000.00 2…
A:
Q: Return on Total Assets A company reports the following income statement and balance sheet…
A: Return on total assets = (Net income + Interest expense) /Average total assets
Q: Horizontal Analysis of Income Statement The following data (in millions) are taken from the…
A: Working note:
Q: Return on total assets A company reports the following income statement and balance sheet…
A: The answer is as fallows
Q: a. Prepare a vertical analysis of Midnight Enterprises' income statements. If required, round…
A: Solution:- a)Preparation of Vertical analysis as follows under:- Note:- Income statement vertical…
Q: Horizontal Analysis of Income Statement The following data (in millions) are taken from the…
A: Horizontal Analysis: Horizontal analysis is an approach that is used to analyze the financial…
Q: Prepare a horizontal analysis of both the balance sheet and income statement. Complete this question…
A: Increase/(decrease) = Year 4 amount - Year 3 amount % change = Increase (decrease)/Year 3 amount
Q: Two income statements for Paragon Company follow: Paragon Company Income Statements For the Years…
A: The horizontal analysis is performed as comparing the current year results with past year results.…
Q: A vertical analysis of two income statements for Danielle's Design Services is shown below:…
A: The horizontal analysis analyze the financial statements of the business pf different 2 years with…
Q: Ratio Analysis of Comparative Financial Statements Amounts from the comparative income statement…
A: Ratio analysis is a process of analyzing the ratios which is meant to understand the performance of…
Q: Following is the income statement for Lowe's Companies Inc. LOWE'S COMPANIES INC. Consolidated…
A: NOPAT is considered as a precise and accurate indicator for the purpose of measuring the…
Q: A company reports the following income statement and balance sheet information for current year:…
A: Return on total assets :— It is the Ratio that determines the company's return with respect to total…
Q: Two income statements for Cornea Company follow: Cornea Company Income Statements For the Years…
A: Comparative balance sheet used to compare the financial statement of two or more periods. It is…
Q: Ratio Analysis of Comparative Financial Statements Amounts from the comparative income statement…
A: Ratio analysis is one of the analytical tools where the data is quantified in such format to analyse…
Q: (b) Prepare a vertical analysis of the income statement data for Oriole Corporation for both years.…
A: vertical analysis is to show that the relative sizes of different accounts on a financial statement…
Q: Case 1 Given the following financial statements historical ratios, and industry averages, calculate…
A: Current Ratio: It is a liquidity ratio that assesses a company's capacity to pay short-term…
Q: Return on total assets A company reports the following income statement and balance sheet…
A: Calculation of return on assets.
Q: Case 1 Given the following financial statements historical ratios, and industry averages, calculate…
A: miramiracle Answered 15 seconds ago 1. Earnings per share = $3.05 2. Price-earnings ratio = 12.95
Q: A company reports the following income statement and balance sheet information for the current year:…
A: Return on total assets is the ratio of net income with average total assets in the business. Return…
Q: Prepare a horizontal analysis of Paragon Company’s income statements. If required, round your…
A: Percentage of increase/(decrease) = Increase amount/(Decrease amount)/Beginning balance (20Y6)
Q: Vertical Analysis Two income statements for Upward Company follow: Upward Company Income Statements…
A: Vertical analysis of the income statement indicates analyzing each item include in the income…
Q: Belnap Company has provided the following partial comparative balance sheets and the income…
A: Cash flow from Operating Activities relate to the cash flow generated from operations of the…
Q: Vertical analysis Two income statements for Cornea Company follow: Cornea Company Income…
A: Working note:
Q: How do you solve this problem (only asking about Problem 1-4. Wasn't sure if you need the previous…
A: Prepare a comparative income statement analysis of Eastman corporation as shown below:
Q: Two income statements for Toby Sam Enterprises are shown below. Toby Sam EnterprisesIncome…
A: Vertical analysis: The comparison of an item of a financial statement against the total amount of…
Q: Two income statements for Cornea Company follow: Cornea Company Income Statements For the Years…
A: Vertical analysis means analysis of every item of the income statement as a percentage of sales.
Q: Express the following comparative income statements in common-size percents. Using the common-size…
A: Income statement of the business shows all incomes and expenses at the end of the financial period.…
Q: The following infornation relates to Hodge Unlimited for the past two years. Account Net…
A: In order to determine the current ratio, the current assets are required to be divided by the…
Trending now
This is a popular solution!
Step by step
Solved in 3 steps
- eBook Show Me How Video Question Content Area Accounting Equation The total assets and total liabilities for a recent year of Best Buy (BBY) and Gamestop (GME) are shown below. Best Buy (in millions) Gamestop (in millions) Assets $22,022 $7,906 Liabilities 14,535 4,325 This information has been collected in the Microsoft Excel Online file. Open the spreadsheet, perform the required analysis, and input your answers in the question below. Open spreadsheet Determine the stockholders' equity of each company. Best Buy $fill in the blank 2 million Gamestop $fill in the blank 3 million16) When creating a new QuickBooks data file for an existing company, QuickBooks automatically offsets accounts receivable balances with an entry to the:A) Uncategorized Expenses accountB) Uncategorized Income accountC) Opening Balance Equity accountD) Capital Stock account Group of answer choices A B C DDoggly Inc shows current assets of $105, net fixed assets of $350, Iong-term debt of $80 and owners equity of $250. What is the value of the firm's current liabilities if they are the only remaining balance sheet item? -$20 O $20 $125 $145 $330 Previous No new data to save. Last checked at 12:52pm Stop sharing Hide Honorlock is sharing your screen with app.honorlock.com
- SEARCH ASK CHAT MATH SOLVER Question Jack Shellenkamp owns and manages a computer repair service, which had the following trial balance on December 31, 2009 (the end of its fiscal year) BYTE REPAIR SERVICETrial BalanceDecember 31, 2009Cash $ 8,000Accounts Receivable 15,000Parts Inventory 13,000Prepaid Rent 3,000Shop Equipment 21,000Accounts Payable $19,000Jack Shellenkamp, Capital 41,000$60,000 $60,000Summarized transactions for January 2010 were as follows:1. Advertising costs, paid in cash, $1,000.2. Additional repair parts inventory acquired on account $4,000.3. Miscellaneous expenses, paid in cash, $2,000.4. Cash collected from customers in payment of accounts receivable $14,000.5. Cash paid to creditors for accounts payable due $15,000.6. Repair parts used during January $4,000. (Hint: Debit this to Repair Parts Expense.)7. Repair services performed during January: for cash $6,000; on account $9,000.8. Wages for January, paid in cash, $3,000.9.…Complete the following problems on an excel spreadsheet. Number your problems on a different tab. PA3 requires two special journals and a subsidiary ledger. PA3. The following transactions occurred for Donaldson Inc. during the month of July. Record the transactions for Donaldson Inc. in the proper special journal and subsidiary ledger. Jul. 1 Sold 50 items to Palm Springs Inc. and offered terms of 2/10, n/30, $4,000 on July 1, and issued invoice #12 on account number #312 Jul. 5 Sold 20 thing-a-jigs to Miami Inc. for $2,150 cash on July 5, and issued invoice #13 Jul. 8 Sold 30 what-is to Smith Mfg. for $5,000 and offered terms of 2/10, n/30; issued invoice #14 on account number #178 Jul. 9 Received payment from Palm Springs Inc. Jul. 22 Received payment from Smith Mfg. after expiration of the discount period5points eBookHintReferences Check my workCheck My Work button is now enabled Item1 Oroblanco Company has prepared consolidated financial statements for the current year and is now gathering information in connection with the following five operating segments it has identified. (Figures are in thousands.) Accounts Company Total Books Computers Maps Travel Finance Sales to outside parties $ 1,735 $ 191 $ 752 $ 447 $ 345 $ 0 Intersegment sales 559 43 290 58 168 0 Interest income—external 130 74 0 0 0 56 Interest income—intersegment loans 166 0 0 0 0 166 Assets 3,715 256 1,473 298 353 1,335 Operating expenses 1,560 134 868 297 209 52 Expenses—intersegment sales 264 89 70 40 65 0 Interest expense—external 126 0 0 0 0 126 Interest expense—intersegment loans 223 40 90 57 36 0 Income tax expense (savings) 140 62 (22) 77 81 (58) General corporate expenses 105 - - - - - Unallocated operating costs 130 - - - - - Required: Determine the reportable…
- Marked out of 20.00P Flag questionusing the income summary account for the month ofSiren MarketingAdjusted Trial BalanceMay 31, 2022Account TitleCashDebitCredit$8, 600Accounts Receivable$2, 500Prepaid Insurance$2,700 Accounts PayableUnearned RevenueKirk, Capital$1, 200$1, 800$5, 880Kirk, Withdrawals$1,600Service Revenue$8, 620Advertising Expenselnsurance ExpenseRent Expense Total$790$450$860$17,500 $17,500No comma or dollar sign should be included in the imput icklPrepare the closing entries in the proper order. For transactions that have more than 1 debit or more than 1 deditDebitAccount Title and Explanation Date May 31Key comparative figures for both Apple and Google follow. Apple Google $ millions Current Year Prior Year Current Year Prior Year Liabilities + Equity $365,725 $375,319 $232,792 $197,295 Net income 59,531 48,351 30,736 12,662 Revenues 265,595 229,234 136,189 110,855 Required:1. What is the total amount of assets invested for the current year in (a) Apple and (b) Google?2. What is the current-year return on assets for (a) Apple and (b) Google?3. How much are current-year expenses for (a) Apple and (b) Google?4-a. Is the current-year return on assets better than the 10% return of competitors for Apple?4-b. Is the current-year return on assets better than the 10% return of competitors for Google?5. Relying only on return on assets, would we invest in Google or Apple?Avatar Corp Journal entries. What is the correct titles and how does the $180000 net income get journaled? See attached image. I keep striking out with my entries
- CONDUCTING A FINANCIAL RATIO ANALYSIS ON HP INC. Use online resources to work on this chapters questions. Please note that website information changes over time, and these changes may limit your ability to answer some of these questions. In Chapter 3, we looked at Dunkin Brands financial statements. In this chapter, we will use a financial Internet website, www.morningstar.com, to analyze HP Inc., a computer hardware company. Once on the website, you simply enter HP Inc.s ticker symbol (HPQ) to obtain the financial information needed. We will also perform a trend analysis, where we evaluate changes in key ratios over time. Through the Morningstar website, you can find the firms financials (Income Statement, Balance Sheet, and Cash Flow) on an annual or quarterly basis for the five most recent time periods. In addition, the site contains Key Ratios (Profitability, Growth, Cash Flow, Financial Health, and Efficiency) for 10 years. We will use the Key Ratios on this site to conduct the firms trend analysis. (At the bottom of the screen you will see that you can click Glossary to find definitions for the different ratios. For example, Morningstars Financial Leverage ratio is the same as the Equity multiplier that we use in the textbook.) Looking at Morningstars Financial Health ratios, what has happened to HPs liquidity position over the past 10 years?CONDUCTING A FINANCIAL RATIO ANALYSIS ON HP INC. Use online resources to work on this chapters questions. Please note that website information changes over time, and these changes may limit your ability to answer some of these questions. In Chapter 3, we looked at Dunkin Brands financial statements. In this chapter, we will use a financial Internet website, www.morningstar.com, to analyze HP Inc., a computer hardware company. Once on the website, you simply enter HP Inc.s ticker symbol (HPQ) to obtain the financial information needed. We will also perform a trend analysis, where we evaluate changes in key ratios over time. Through the Morningstar website, you can find the firms financials (Income Statement, Balance Sheet, and Cash Flow) on an annual or quarterly basis for the five most recent time periods. In addition, the site contains Key Ratios (Profitability, Growth, Cash Flow, Financial Health, and Efficiency) for 10 years. We will use the Key Ratios on this site to conduct the firms trend analysis. (At the bottom of the screen you will see that you can click Glossary to find definitions for the different ratios. For example, Morningstars Financial Leverage ratio is the same as the Equity multiplier that we use in the textbook.) Looking at Morningstars Profitability ratios, what has happened to HPs profit margin (net margin %) over the past 10 years? What has happened to its return on assets (ROA) and return on equity (ROE) over the past 10 years?CONDUCTING A FINANCIAL RATIO ANALYSIS ON HP INC. Use online resources to work on this chapters questions. Please note that website information changes over time, and these changes may limit your ability to answer some of these questions. In Chapter 3, we looked at Dunkin Brands financial statements. In this chapter, we will use a financial Internet website, www.morningstar.com, to analyze HP Inc., a computer hardware company. Once on the website, you simply enter HP Inc.s ticker symbol (HPQ) to obtain the financial information needed. We will also perform a trend analysis, where we evaluate changes in key ratios over time. Through the Morningstar website, you can find the firms financials (Income Statement, Balance Sheet, and Cash Flow) on an annual or quarterly basis for the five most recent time periods. In addition, the site contains Key Ratios (Profitability, Growth, Cash Flow, Financial Health, and Efficiency) for 10 years. We will use the Key Ratios on this site to conduct the firms trend analysis. (At the bottom of the screen you will see that you can click Glossary to find definitions for the different ratios. For example, Morningstars Financial Leverage ratio is the same as the Equity multiplier that we use in the textbook.) Looking at Morningstars Financial Health ratios, what has happened to HPs financial leverage position (looking at both its financial leverage and debt/equity ratios) over the past 10 years?