54 Financial Statement Analysis YEAR 7 YEAR 6 YEAR 5 Change in Percent Index Change in Index Index Statement Item No. Percent No. No. Net sales 29% 100 90 Cost of goods sold Gross profit Operating expenses 139 100 85 126 100 80 20 100 65 100 Income before tax 14 70 CHECK Year 6 net income 129 Net income 100 75 percent, 33.3% Perform a comparative analysis of Eastman Corporation by completing the analysis below. Describe and comment on any significant findings in your comparative analysis. PROBLEM 1-3 Comparative Income Statement Analysis EASTMAN CORPORATION Income Statement ($ millions) For Years Ended December 31 Average Annual Cumulative Year 6 Year 5 Year 4 Amount Amount Net sales .. 2$ 2,610 $3,490 $2,860 24 Cost of goods sold 3,210 Gross profit 3,670 1,800 680 1,050 Operating expenses Income before taxes 2,740 215 105 $ 58 $ 145 $1,485 Net income CНЕCK Average net income, $563 Compute increases (decreases) in percents for both Years 6 and 7 by entering all the missing data in the table below. Analyze and interpret any significant results revealed from this trend analysis. PROBLEM 1-4 Index-Number Trend Analysis
54 Financial Statement Analysis YEAR 7 YEAR 6 YEAR 5 Change in Percent Index Change in Index Index Statement Item No. Percent No. No. Net sales 29% 100 90 Cost of goods sold Gross profit Operating expenses 139 100 85 126 100 80 20 100 65 100 Income before tax 14 70 CHECK Year 6 net income 129 Net income 100 75 percent, 33.3% Perform a comparative analysis of Eastman Corporation by completing the analysis below. Describe and comment on any significant findings in your comparative analysis. PROBLEM 1-3 Comparative Income Statement Analysis EASTMAN CORPORATION Income Statement ($ millions) For Years Ended December 31 Average Annual Cumulative Year 6 Year 5 Year 4 Amount Amount Net sales .. 2$ 2,610 $3,490 $2,860 24 Cost of goods sold 3,210 Gross profit 3,670 1,800 680 1,050 Operating expenses Income before taxes 2,740 215 105 $ 58 $ 145 $1,485 Net income CНЕCK Average net income, $563 Compute increases (decreases) in percents for both Years 6 and 7 by entering all the missing data in the table below. Analyze and interpret any significant results revealed from this trend analysis. PROBLEM 1-4 Index-Number Trend Analysis

Chapter1: Financial Statements And Business Decisions
Section: Chapter Questions
Problem 1Q

Related questions
Question
100%
How do you solve this problem (only asking about Problem 1-4. Wasn't sure if you need the previous charf in Problem 1-3 however, this is included in the image. I am totally lost as to the answer for Net Inc for year 6 being 33%of change (according to the book). How is this possible? Please advise.
Thanks,
Transcribed Image Text:54
Financial Statement Analysis
YEAR 7
YEAR 6
YEAR 5
Change in
Percent
Index
Change in
Index
Index
Statement Item
No.
Percent
No.
No.
Net sales
29%
100
90
Cost of goods sold
Gross profit
Operating expenses
139
100
85
126
100
80
20
100
65
100
Income before tax
14
70
CHECK
Year 6 net income
129
Net income
100
75
percent, 33.3%
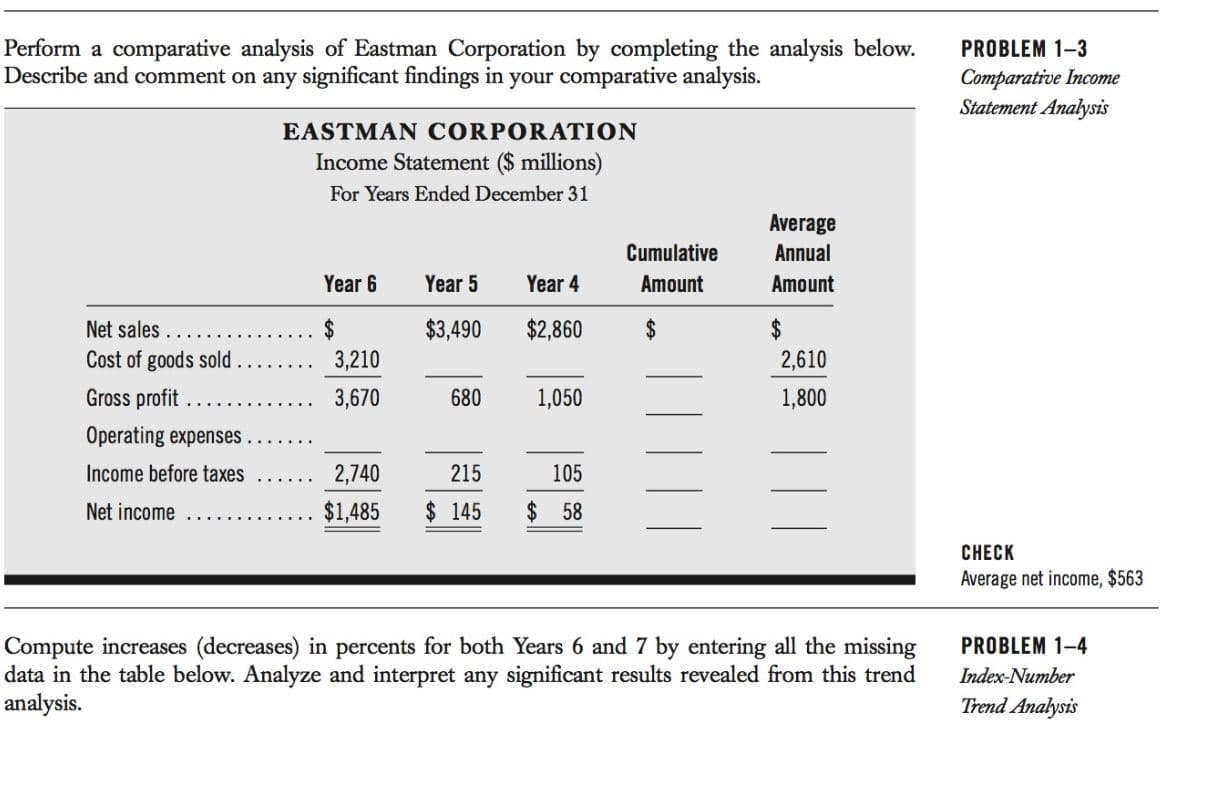
Transcribed Image Text:Perform a comparative analysis of Eastman Corporation by completing the analysis below.
Describe and comment on any significant findings in your comparative analysis.
PROBLEM 1-3
Comparative Income
Statement Analysis
EASTMAN CORPORATION
Income Statement ($ millions)
For Years Ended December 31
Average
Annual
Cumulative
Year 6
Year 5
Year 4
Amount
Amount
Net sales ..
2$
2,610
$3,490
$2,860
24
Cost of goods sold
3,210
Gross profit
3,670
1,800
680
1,050
Operating expenses
Income before taxes
2,740
215
105
$ 58
$ 145
$1,485
Net income
CНЕCK
Average net income, $563
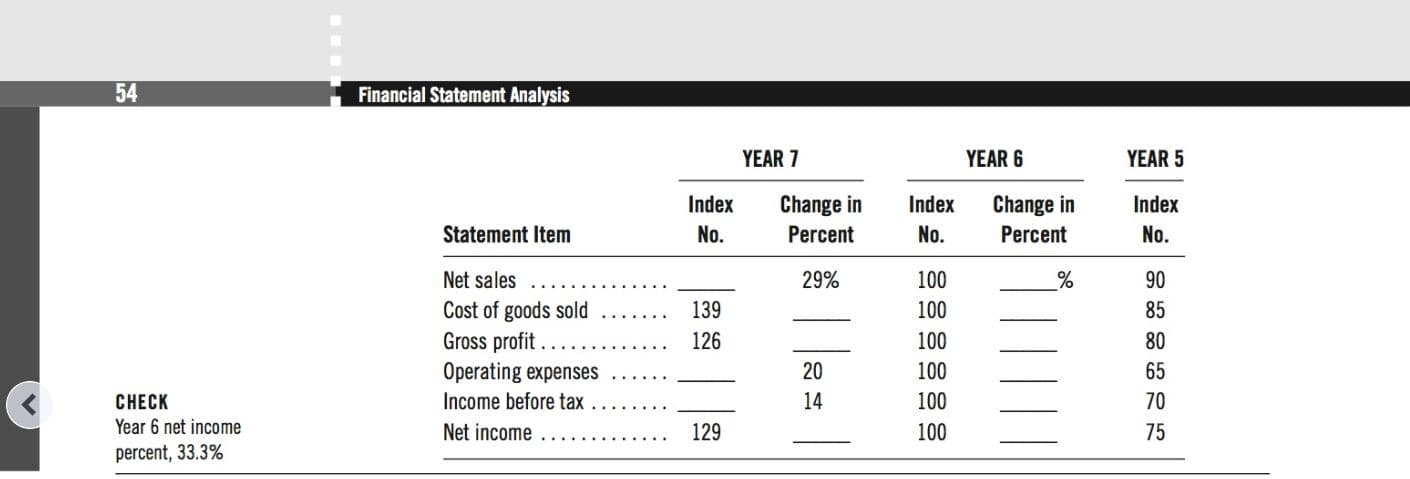
Compute increases (decreases) in percents for both Years 6 and 7 by entering all the missing
data in the table below. Analyze and interpret any significant results revealed from this trend
analysis.
PROBLEM 1-4
Index-Number
Trend Analysis
Expert Solution
This question has been solved!
Explore an expertly crafted, step-by-step solution for a thorough understanding of key concepts.

This is a popular solution!

Trending now
This is a popular solution!

Step by step
Solved in 6 steps with 6 images

Knowledge Booster


Learn more about
Need a deep-dive on the concept behind this application? Look no further. Learn more about this topic, accounting and related others by exploring similar questions and additional content below.Recommended textbooks for you

Accounting
Accounting
ISBN:
9781337272094
Author:
WARREN, Carl S., Reeve, James M., Duchac, Jonathan E.
Publisher:
Cengage Learning,

Accounting Information Systems
Accounting
ISBN:
9781337619202
Author:
Hall, James A.
Publisher:
Cengage Learning,
Accounting
Accounting
ISBN:
9781337272094
Author:
WARREN, Carl S., Reeve, James M., Duchac, Jonathan E.
Publisher:
Cengage Learning,
Accounting Information Systems
Accounting
ISBN:
9781337619202
Author:
Hall, James A.
Publisher:
Cengage Learning,

Horngren's Cost Accounting: A Managerial Emphasis…
Accounting
ISBN:
9780134475585
Author:
Srikant M. Datar, Madhav V. Rajan
Publisher:
PEARSON

Intermediate Accounting
Accounting
ISBN:
9781259722660
Author:
J. David Spiceland, Mark W. Nelson, Wayne M Thomas
Publisher:
McGraw-Hill Education

Financial and Managerial Accounting
Accounting
ISBN:
9781259726705
Author:
John J Wild, Ken W. Shaw, Barbara Chiappetta Fundamental Accounting Principles
Publisher:
McGraw-Hill Education