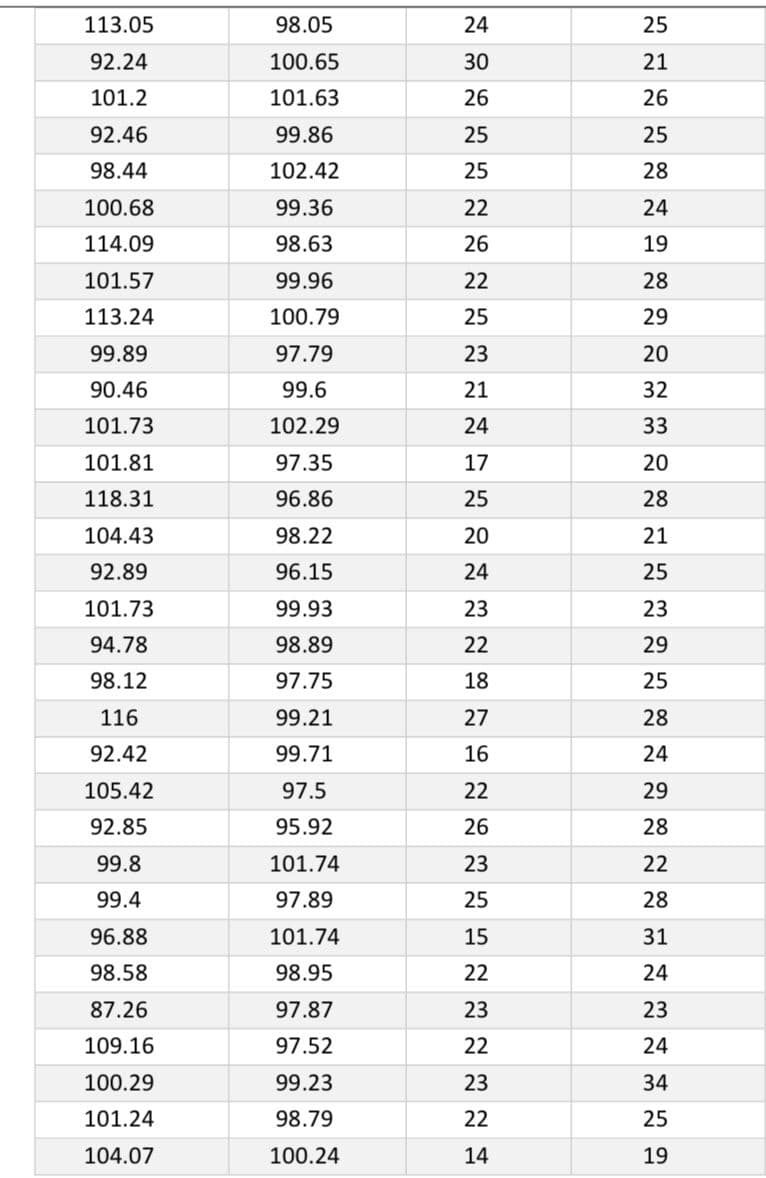
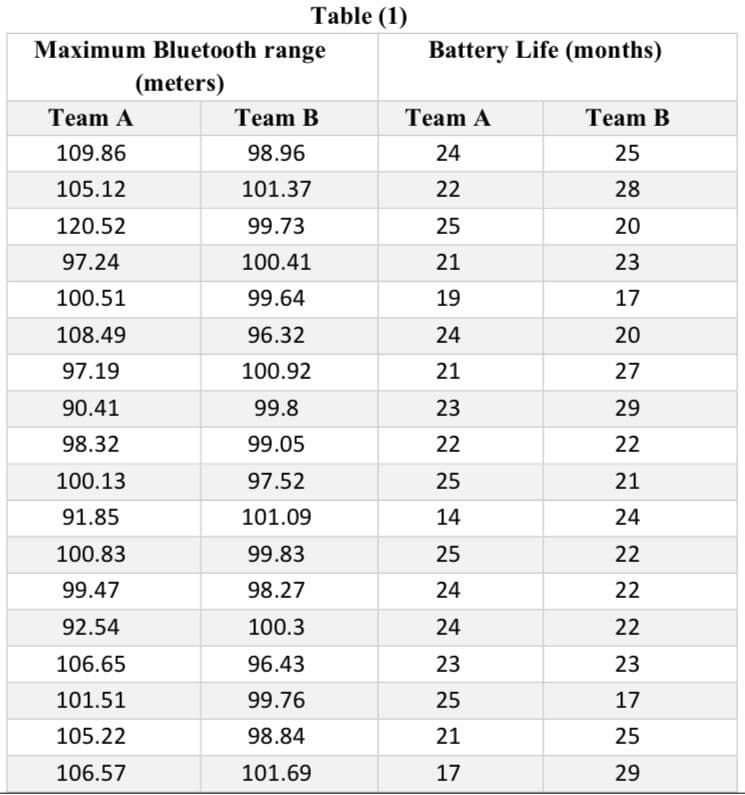
Two teams (A and B) are trying to improve AirTag quality by increasing the maximum Bluetooth range of the AirTag. Your supervisor asked you to compare the two different prototypes by the teams. You need to examine 50 AirTag samples from each team (i.e., total of 100 AirTags from both teams) and measure their maximum Bluetooth range. Use the maximum Bluetooth range results for the prototypes designed by team A and team B shown in table 1 below to determine the following: (1-a) What is the mean, mode, median, and standard deviation of the maximum Bluetooth range for each team of AirTag? Show all work. (1-b) Divide each data group into five categories and create the frequency table. (1-c) Calculate the mean and standard deviation from the frequency tables and compare them to the results found in part (1-a). (1-d) Present the data as a histogram. (1-e) Present the data as a frequency polygon Note : last two numper = 20


Two teams (A and B) are trying to improve AirTag quality by increasing the maximum Bluetooth
You need to examine 50 AirTag samples from each team (i.e., total of 100 AirTags from both teams)
and measure their maximum Bluetooth range.
Use the maximum Bluetooth range results for the prototypes designed by team A and team B shown
in table 1 below to determine the following:
(1-a) What is the
each team of AirTag? Show all work.
(1-b) Divide each data group into five categories and create the frequency table.
(1-c) Calculate the mean and standard deviation from the frequency tables and compare them to the
results found in part (1-a).
(1-d) Present the data as a histogram.
(1-e) Present the data as a frequency
Note : last two numper = 20

Step by step
Solved in 6 steps with 4 images

