k=1 The sample variance is an unbiased estimator of o2. The sample standard deviation is defined as S = √S², and is commonly used as an estimator for o. Nevertheless, S is a biased estimator of σ.
k=1 The sample variance is an unbiased estimator of o2. The sample standard deviation is defined as S = √S², and is commonly used as an estimator for o. Nevertheless, S is a biased estimator of σ.

Algebra & Trigonometry with Analytic Geometry
13th Edition
ISBN:9781133382119
Author:Swokowski
Publisher:Swokowski
Chapter10: Sequences, Series, And Probability
Section10.8: Probability
Problem 31E

Related questions
Question
i need the answer quickly
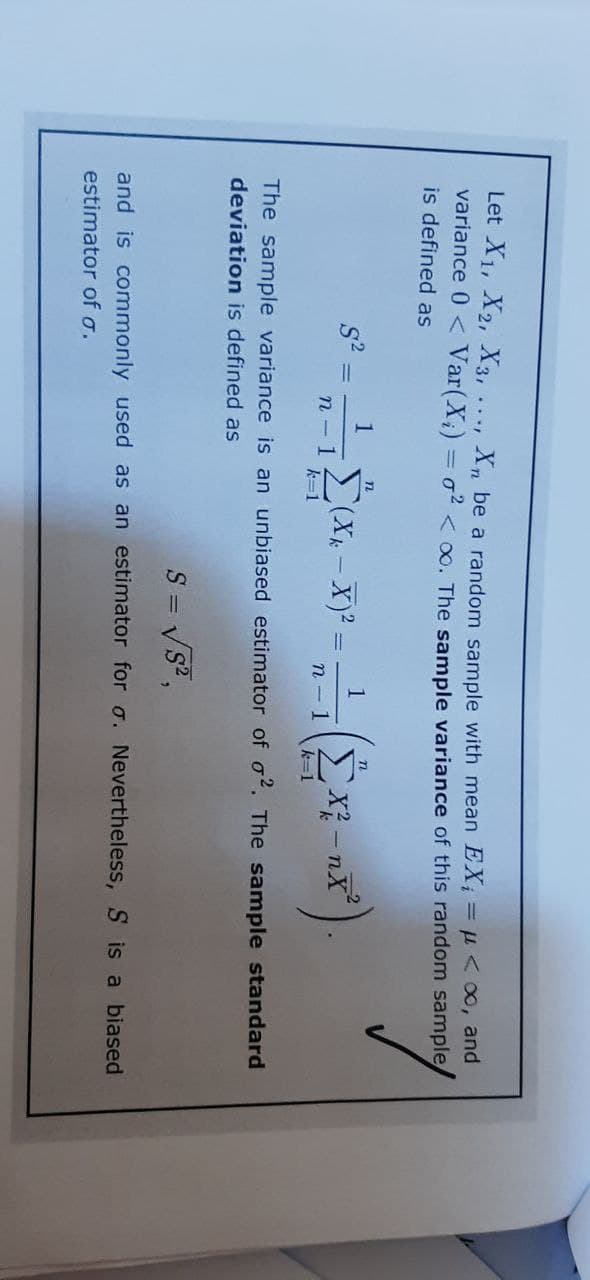
Transcribed Image Text:Let X₁, X2, X3, ..., Xn be a random sample with mean EX₁ = μ<∞, and
variance 0 < Var (X₂) = o² <oo. The sample variance of this random sample
is defined as
n
n
1
S²
1
(X-X) ²: (x²
Σx - nx
1-nt²
n-1
n-1
k=1
The sample variance is an unbiased estimator of o2. The sample standard
deviation is defined as
S = √S²,
and is commonly used as an estimator for o. Nevertheless, S is a biased
estimator of σ.
Expert Solution
This question has been solved!
Explore an expertly crafted, step-by-step solution for a thorough understanding of key concepts.

This is a popular solution!

Trending now
This is a popular solution!

Step by step
Solved in 3 steps with 3 images

Recommended textbooks for you
Algebra & Trigonometry with Analytic Geometry
Algebra
ISBN:
9781133382119
Author:
Swokowski
Publisher:
Cengage
Algebra & Trigonometry with Analytic Geometry
Algebra
ISBN:
9781133382119
Author:
Swokowski
Publisher:
Cengage