udnury's bowling ball factory in llinois , in pounds, of 9 of the bowling balls produced that day has been assessed as follows: makes bowling balls of adult size and weight only. The standard deviation in the weight of a bowling ball produced at the factory is known to be 0.18 pounds. Each dây for 24 days, the average Average Average (Ib.) Average (Ib.) Average Day Day (Ib.) Day Day (Ib.) 1 14.4 7 13.6 13 13.6 19 13.8 2 14.0 13.7 14 13.6 20 13.9 3 13.7 9 13.7 15 13.6 21 13.6 4 14.1 10 14.1 16 13.9 22 13.8 5 13.6 11 13.8 17 13.7 23 13.8 6 14.1 12 14.1 18 13.6 24 14.1 ablish control chart for monitoring the average weights of the bowling balls in which the upper and lower control limits are each two standard deviations from the mean. What are the values of the control limits? oper Control Limit (UCL;)= 13.95 Ib. (round your response to two decimal places). wer Control Limit (LCL-) = 13.71 Ib. (round your response to two decimal places). ree standard deviations are used in the chart, what are the values of the control limits? oper Control Limit (UCL-)= 14.01 Ib. (round your response to two decimal places). wer Control Limit (LCL;)= 13.65 lb. (round your response to two decimal places). o these values change? The control limits are tighter for the 2-sigma x-chart than for the 3-sigma x-chart. The control limits are tighter for the 3-sigma x-chart than for the 2-sigma x-chart. The control limits for the 2-sigma x-chart and for the 3-sigma x-chart are the same.
udnury's bowling ball factory in llinois , in pounds, of 9 of the bowling balls produced that day has been assessed as follows: makes bowling balls of adult size and weight only. The standard deviation in the weight of a bowling ball produced at the factory is known to be 0.18 pounds. Each dây for 24 days, the average Average Average (Ib.) Average (Ib.) Average Day Day (Ib.) Day Day (Ib.) 1 14.4 7 13.6 13 13.6 19 13.8 2 14.0 13.7 14 13.6 20 13.9 3 13.7 9 13.7 15 13.6 21 13.6 4 14.1 10 14.1 16 13.9 22 13.8 5 13.6 11 13.8 17 13.7 23 13.8 6 14.1 12 14.1 18 13.6 24 14.1 ablish control chart for monitoring the average weights of the bowling balls in which the upper and lower control limits are each two standard deviations from the mean. What are the values of the control limits? oper Control Limit (UCL;)= 13.95 Ib. (round your response to two decimal places). wer Control Limit (LCL-) = 13.71 Ib. (round your response to two decimal places). ree standard deviations are used in the chart, what are the values of the control limits? oper Control Limit (UCL-)= 14.01 Ib. (round your response to two decimal places). wer Control Limit (LCL;)= 13.65 lb. (round your response to two decimal places). o these values change? The control limits are tighter for the 2-sigma x-chart than for the 3-sigma x-chart. The control limits are tighter for the 3-sigma x-chart than for the 2-sigma x-chart. The control limits for the 2-sigma x-chart and for the 3-sigma x-chart are the same.

Glencoe Algebra 1, Student Edition, 9780079039897, 0079039898, 2018
18th Edition
ISBN:9780079039897
Author:Carter
Publisher:Carter
Chapter10: Statistics
Section10.4: Distributions Of Data
Problem 19PFA

Related questions
Question
q4
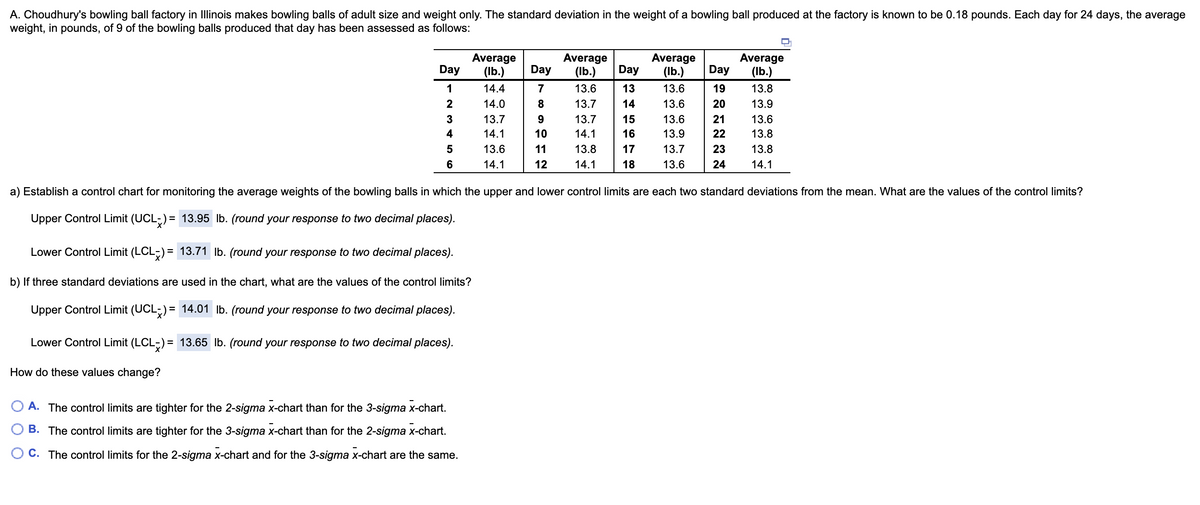
Transcribed Image Text:A. Choudhury's bowling ball factory in Illinois makes bowling balls of adult size and weight only. The standard deviation in the weight of a bowling ball produced at the factory is known to be 0.18 pounds. Each day for 24 days, the average
weight, in pounds, of 9 of the bowling balls produced that day has been assessed as follows:
Average
Average
(Ib.)
Average
(Ib.)
Average
Day
(Ib.)
Day
Day
Day
(Ib.)
1
14.4
7
13.6
13
13.6
19
13.8
2
14.0
13.7
14
13.6
20
13.9
3
13.7
13.7
15
13.6
21
13.6
4
14.1
10
14.1
16
13.9
22
13.8
5
13.6
11
13.8
17
13.7
23
13.8
6
14.1
12
14.1
18
13.6
24
14.1
a) Establish a control chart for monitoring the average weights of the bowling balls in which the upper and lower control limits are each two standard deviations from the mean. What are the values of the control limits?
Upper Control Limit (UCL;) = 13.95 lb. (round your response to two decimal places).
Lower Control Limit (LCL-) = 13.71 lb. (round your response to two decimal places).
b) If three standard deviations are used in the chart, what are the values of the control limits?
Upper Control Limit (UCL;) = 14.01 Ib. (round your response to two decimal places).
Lower Control Limit (LCL-) = 13.65 Ilb. (round your response to two decimal places).
How do these values change?
A. The control limits are tighter for the 2-sigma x-chart than for the 3-sigma x-chart.
B. The control limits are tighter for the 3-sigma x-chart than for the 2-sigma x-chart.
C. The control limits for the 2-sigma x-chart and for the 3-sigma x-chart are the same.
Expert Solution
This question has been solved!
Explore an expertly crafted, step-by-step solution for a thorough understanding of key concepts.

This is a popular solution!

Trending now
This is a popular solution!

Step by step
Solved in 2 steps with 1 images

Recommended textbooks for you
Glencoe Algebra 1, Student Edition, 9780079039897…
Algebra
ISBN:
9780079039897
Author:
Carter
Publisher:
McGraw Hill
Glencoe Algebra 1, Student Edition, 9780079039897…
Algebra
ISBN:
9780079039897
Author:
Carter
Publisher:
McGraw Hill