Unlike most packaged food products, alcohol beverage container labels are not required to show calorie or nutrient content. An article reported on a pilot study in which each of 55 individuals in a sample was asked to estimate the calorie content of a 12 oz can of beer known to contain 153 calories. The resulting sample mean estimated calorie level was 193 and the sample standard deviation was 88. Does this data suggest that the true average estimated calorie content in the population sampled exceeds the actual content? Test the appropriate hypotheses at significance level 0.001. State the appropriate null and alternative hypotheses. 153 Ha: > 153 Ho: Ho: Ha: 153 Ho: #= 153 153 H₂: HS 153 Ho: #= 153 H₂: # < 153 z = Calculate the test statistic and determine the P-value. (Round your test statistic to two decimal places and your P-value to four decimal places.) P-value= State the conclusion in the problem context. Reject the null hypothesis. There is sufficient evidence that the true average estimated calorie content of this beer exceeds the actual content. Reject the null hypothesis. There is not sufficient evidence that the true average estimated calorie content of this beer exceeds the actual content. Do not reject the null hypothesis. There is not sufficient evidence that the true average estimated calorie content of this beer exceeds the actual content. Do not reject the null hypothesis. There is sufficient evidence that the true average estimated calorie content of this beer exceeds the actual content. You may need to use the appropriate table in the Appendix of Tables to answer this question.
Unlike most packaged food products, alcohol beverage container labels are not required to show calorie or nutrient content. An article reported on a pilot study in which each of 55 individuals in a sample was asked to estimate the calorie content of a 12 oz can of beer known to contain 153 calories. The resulting sample mean estimated calorie level was 193 and the sample standard deviation was 88. Does this data suggest that the true average estimated calorie content in the population sampled exceeds the actual content? Test the appropriate hypotheses at significance level 0.001. State the appropriate null and alternative hypotheses. 153 Ha: > 153 Ho: Ho: Ha: 153 Ho: #= 153 153 H₂: HS 153 Ho: #= 153 H₂: # < 153 z = Calculate the test statistic and determine the P-value. (Round your test statistic to two decimal places and your P-value to four decimal places.) P-value= State the conclusion in the problem context. Reject the null hypothesis. There is sufficient evidence that the true average estimated calorie content of this beer exceeds the actual content. Reject the null hypothesis. There is not sufficient evidence that the true average estimated calorie content of this beer exceeds the actual content. Do not reject the null hypothesis. There is not sufficient evidence that the true average estimated calorie content of this beer exceeds the actual content. Do not reject the null hypothesis. There is sufficient evidence that the true average estimated calorie content of this beer exceeds the actual content. You may need to use the appropriate table in the Appendix of Tables to answer this question.

Glencoe Algebra 1, Student Edition, 9780079039897, 0079039898, 2018
18th Edition
ISBN:9780079039897
Author:Carter
Publisher:Carter
Chapter10: Statistics
Section10.4: Distributions Of Data
Problem 19PFA

Related questions
Question
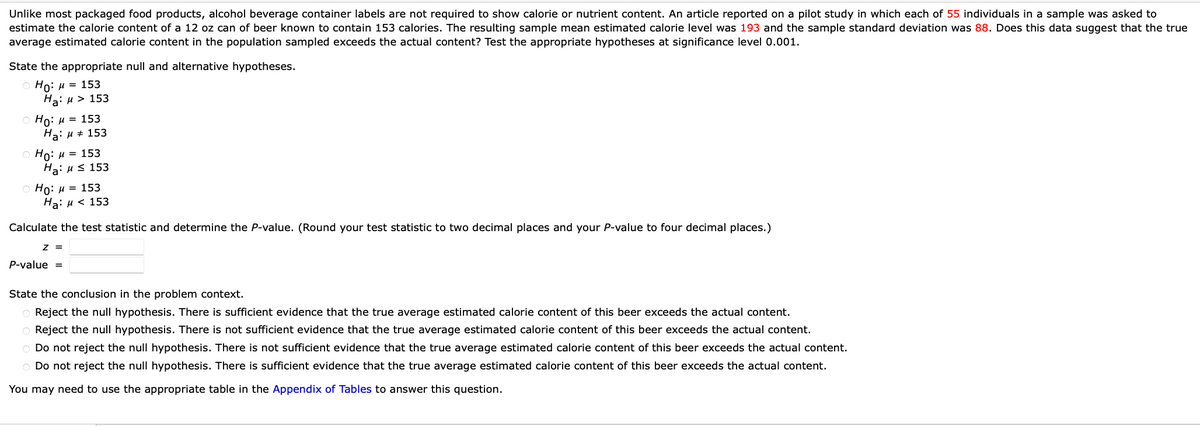
Transcribed Image Text:Unlike most packaged food products, alcohol beverage container labels are not required to show calorie or nutrient content. An article reported on a pilot study in which each of 55 individuals in a sample was asked to
estimate the calorie content of a 12 oz can of beer known to contain 153 calories. The resulting sample mean estimated calorie level was 193 and the sample standard deviation was 88. Does this data suggest that the true
average estimated calorie content in the population sampled exceeds the actual content? Test the appropriate hypotheses at significance level 0.001.
State the appropriate null and alternative hypotheses.
Ho: μ = 153
Ha: μ> 153
Ho: μ = 153
Ha: μ = 153
Ho: μ = 153
Ha: μ ≤ 153
Ho: μ = 153
Ha: μ< 153
Calculate the test statistic and determine the P-value. (Round your test statistic to two decimal places and your P-value to four decimal places.)
Z =
P-value =
State the conclusion in the problem context.
O Reject the null hypothesis. There is sufficient evidence that the true average estimated calorie content of this beer exceeds the actual content.
O Reject the null hypothesis. There is not sufficient evidence that the true average estimated calorie content of this beer exceeds the actual content.
O Do not reject the null hypothesis. There is not sufficient evidence that the true average estimated calorie content of this beer exceeds the actual content.
O Do not reject the null hypothesis. There is sufficient evidence that the true average estimated calorie content of this beer exceeds the actual content.
You may need to use the appropriate table in the Appendix of Tables to answer this question.
Expert Solution
This question has been solved!
Explore an expertly crafted, step-by-step solution for a thorough understanding of key concepts.

This is a popular solution!

Trending now
This is a popular solution!

Step by step
Solved in 4 steps with 1 images

Recommended textbooks for you
Glencoe Algebra 1, Student Edition, 9780079039897…
Algebra
ISBN:
9780079039897
Author:
Carter
Publisher:
McGraw Hill
Glencoe Algebra 1, Student Edition, 9780079039897…
Algebra
ISBN:
9780079039897
Author:
Carter
Publisher:
McGraw Hill