Use a 5% significance level to test the claim that the standard deviation of birthweights of girls is different from the standard deviation of birthweights of boys, which is 530 g.
Use a 5% significance level to test the claim that the standard deviation of birthweights of girls is different from the standard deviation of birthweights of boys, which is 530 g.

Glencoe Algebra 1, Student Edition, 9780079039897, 0079039898, 2018
18th Edition
ISBN:9780079039897
Author:Carter
Publisher:Carter
Chapter10: Statistics
Section10.4: Distributions Of Data
Problem 19PFA

Related questions
Topic Video
Question
For the procedure, the options are on the second screenshot.
Please answer: Procedure, assumptions, and Step 1
Transcribed Image Text:3089.1
2554.3
4395.9
2857
2559
2923.7
3733
3634.4
3067.4
3659.1
3543.5
2271.5
3059.2
3647
3337.2
2438
3171.5
3432.4
2525.4
3165.5
2815
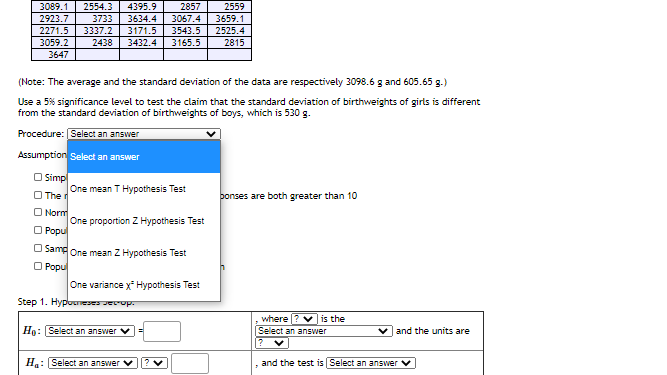
(Note: The average and the standard deviation of the data are respectively 3098.6 g and 605.65 g.)
Use a 5% significance level to test the claim that the standard deviation of birthweights of girls is different
from the standard deviation of birthweights of boys, which is 530 g.
Procedure: Select an answer
Assumption Select an answer
O Simp
One mean T Hypothesis Test
O The d
bonses are both greater than 10
O Norm
One proportion Z Hypothesis Test
O Popu
O Samg One mean Z Hypothesis Test
O Popu
One variance x Hypothesis Test
Step 1. Hypounese Jecop.
where ? is the
Select an answer
Họ: Select an answer
and the units are
H: Select an answer
and the test is Select an ansSwer v
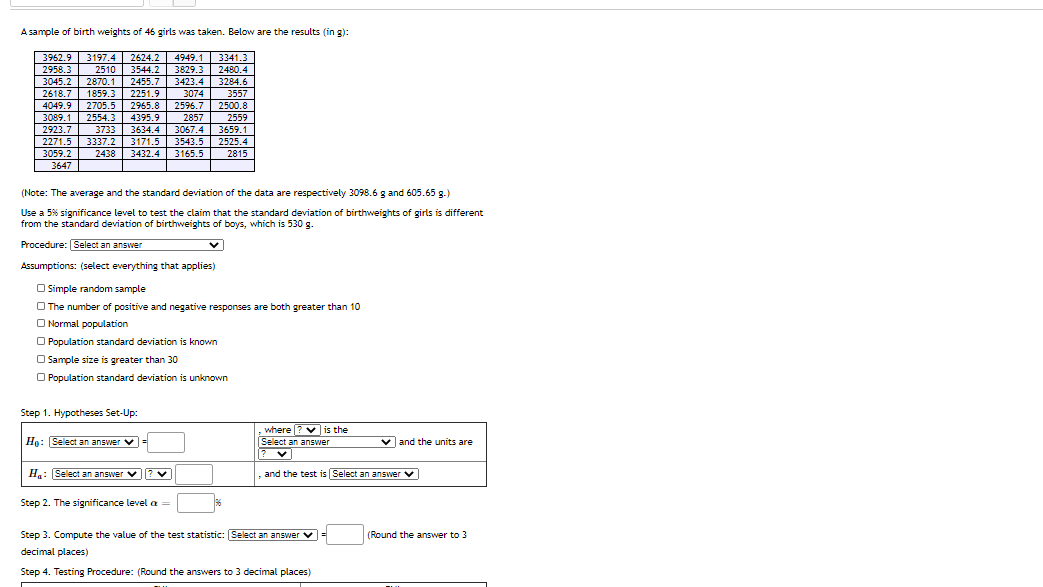
Transcribed Image Text:A sample of birth weights of 45 girls was taken. Below are the results (in g):
3962.9 3197.4 2624.2 4949.1
2958.3
3045.2 2870.1
2618.7
4049.9 2705.5
3341.3
2480.4
2510 3544.2| 3829.3
2455.7
3423.4
3284.6
1859.3
2251.9
2965.8
3074
3557
2596.7
2500.8
2559
3659.1
2525.4
3089.1
2554.3
4395.9
3634.4
2857
2923.7
3733
3067.4
3543.5
3337.2
2271.5
3059.2
3171.5
3432.4 3165.5
2438
2815
3647
(Note: The average and the standard deviation of the data are respectively 3098.6 g and 605.65 g.)
Use a 5% significance level to test the claim that the standard deviation of birthweights of girls is different
from the standard deviation of birthweights of boys, which is 530 g.
Procedure: Select an answer
Assumptions: (select everything that applies)
O Simple random sample
O The number of positive and negative responses are both greater than 10
O Normal population
O Population standard deviation is known
O Sample size is greater than 30
O Population standard deviation is unknown
Step 1. Hypotheses Set-Up:
where
v is the
Ho: Select an answer v
Select an answer
v and the units are
H: Select an answer v? v
and the test is Select an answer v
Step 2. The significance level a =
Step 3. Compute the value of the test statistic: Select an answer v
(Round the answer to 3
decimal places)
Step 4. Testing Procedure: (Round the answers to 3 decimal places)
Expert Solution
This question has been solved!
Explore an expertly crafted, step-by-step solution for a thorough understanding of key concepts.

This is a popular solution!

Trending now
This is a popular solution!

Step by step
Solved in 2 steps

Knowledge Booster


Learn more about
Need a deep-dive on the concept behind this application? Look no further. Learn more about this topic, statistics and related others by exploring similar questions and additional content below.Recommended textbooks for you
Glencoe Algebra 1, Student Edition, 9780079039897…
Algebra
ISBN:
9780079039897
Author:
Carter
Publisher:
McGraw Hill

Holt Mcdougal Larson Pre-algebra: Student Edition…
Algebra
ISBN:
9780547587776
Author:
HOLT MCDOUGAL
Publisher:
HOLT MCDOUGAL
Glencoe Algebra 1, Student Edition, 9780079039897…
Algebra
ISBN:
9780079039897
Author:
Carter
Publisher:
McGraw Hill
Holt Mcdougal Larson Pre-algebra: Student Edition…
Algebra
ISBN:
9780547587776
Author:
HOLT MCDOUGAL
Publisher:
HOLT MCDOUGAL