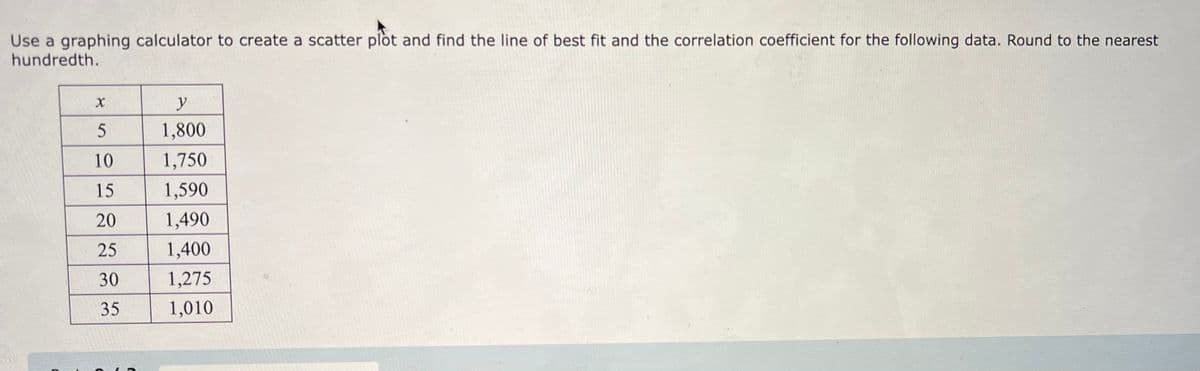
Use a graphing calculator to create a scatter plot and find the line of best fit and the correlation coefficient for the following data. Round to the nearest hundredth. X 5 10 15 20 25 30 35 y 1,800 1,750 1,590 1,490 1,400 1,275 1,010


Q: Part (a) Find the new TC- Part (c) Determine the next improved plan. To Valley (1) FROM Madison…
A: The transportation model is used to calculate the minimum cost of the route by selecting different…
Q: 7- A sourcing strategy for items in the bottleneck quadrant can be to a-adjust specifications to…
A: Ans) 7) A sourcing strategy for items in the bottleneck quadrant can be to 1) increasing…
Q: A project is scheduled to complete in six months duration. There are two activities in the project.…
A: Given data is
Q: Refer to Table S6 1-Factors for Computing Control Chart Limits (3 sigma) for this problem.…
A: Control chart helps to the business to analysis the how process change over time. It has a three…
Q: 5- A sourcing strategy for procuring leverage items would be to? a-use reverse auctions.…
A: Ans) 5) Leverage items are the High profit impact with low supply risk. Not used for decentralized…
Q: a) What is its weeks of supply? weeks (round your response to two decimal places). b) What…
A: Note: We are allowed to do first three sub-parts only. Inventory management is the process of…
Q: In the environment of increased competition, a fitness club executive is considering the purchase of…
A: Decision-making is influenced by an organization as per the degree of certainty involved in this. In…
Q: What is the lead time for an order of peas, in weeks?
A: Lead time for an order is the duration between when a customer places an order and when the customer…
Q: A health and nutrition store stocks a multivitamin with an annual demand of 1,000 bottles has Co =…
A: Given information is: Annual demand = D = 1000 units Cost of ordering = Co = 24.50 Cost of holding =…
Q: Explain how waiting lines can develop even when the service time is a constant.
A: The waiting line is the length of time that a customer has to wait before they are served. The…
Q: Using any organisation of your choice describe the significance of operations managers and how they…
A: Key Advantages inside Effective Operations ManagementProduct Quality - The quality of a product…
Q: Compute and tabulate the daily demand for each month in the table below (round off to the nearest…
A: Note: We are allowed to do one question only. Daily demand is the demand per day. Daily demand =…
Q: Importance of Quality control and Quality assurance for the national and international…
A: Quality is now seen as an issue of concern by many different parties both inside and outside of the…
Q: A renovation of the gift shop at Orlando Amway Center has six activities hours). In the following…
A: The optimistic time (a), most likely time (m), and pessimistic time (b) are given for each activity…
Q: b) Given the demand, the cycle time for the production of the new train set = ____ (round your…
A: As per Bartleby guidelines, we can only solve the first three subparts of one question at a…
Q: e weapon" Justify the statemen
A: Since quality is an integral component of an organization's overall competitive advantage, the…
Q: Given the situation above with an output rate of five units per hour, a) Draw the network precedence…
A: Project schedule helps in calculating different values all related to the production cycle like the…
Q: The Bijou Theater shows vintage movies. Customers arrive at the theater line at the rate of 100 per…
A: Given data: Arrival rate λ= 100 per hour Service rate μ= 360030= 120 per hour
Q: What is the tool used by a project manager to check whether the resources are allocated correctly…
A: There are several tools available nowadays for resource management and overall every tool is similar…
Q: Suppose that the demand in period 1 was 7 units and the demand in period 2 was 9 units. Assume that…
A: Forecasting is a technique used to predict future outcomes on the basis of past data. In businesses…
Q: Demand for walnut fudge ice cream at the Sweet Cream Dairy can be approximated by a normal…
A: 1.28 Given: Mean weekly demand = 21 Standard deviation (s) = 5 Lead time (L) = 8 Z- score…
Q: Torrance Refinery produces approximately 23.1 Million barrels of gasoline per year. A California…
A: Given data: Production per year (p)= 23.1 Million barrel Demand per year (D) = 5.3 Million barrels…
Q: What are the consequences of outsourcing production on the welfare of countries? Discuss in 3 points
A: (1) A scenario known as outsourcing occurs when a corporation decides that a particular area may be…
Q: ABC Wash, Inc., makes commercial and industrial laundry machines (the kinds hotels use), and has…
A: Find the Level Strategy below: a. The Cost of the strategy is $ 1380400 b. Back order Requirement:…
Q: Owen Conner works part-time packaging software for a local distribution company in Indiana. The…
A: Breakeven point indicating the unit level or revenue level which facilitating no cost or loss. Here,…
Q: An appliance store sells microwaves at a steady rate throughout the year. Each microwave costs the…
A:
Q: 9. The following information is given for a CPM network: Activity Predecessor Successor Normal Time…
A: A network diagram is visual representation of a project which helps to identify the project duration…
Q: In your own words, describe cost of quality (COQ) and why an organization should be managing Cost Of…
A: A company's success relies on quality control just because it maintains that only high-quality…
Q: Expando, Inc., is considering the possibility of building an additional factory that would produce a…
A: This is a diagrammatic representation of decisions available to choose from considering the…
Q: T/F question Inventory costs increase as the number of facilities in a supply chain increases.
A: A supply chain is a system - of all the people, enterprises, resources, actions, & technological…
Q: An institution has 7 departments. The closeness chart is given in the following table. 1. Material…
A: Here consider: Here 1 Material Storage 2 Forming 3 Machining 4 Painting 5 Assembly…
Q: Exponential Smoothing when α= .6 and the forecast for March is 350.
A: Exponential smoothing is one of the methods of forecasting. It is used in case of time-series demand…
Q: Using the following, forecast the sales for the months up to January the following year:- A simple…
A: The mean absolute deviation (MAD) is a measure of the accuracy of forecasts. It measures how far off…
Q: Question 2 Read the case study below and answer the following questions: Colgate-Palmolive Supply…
A: Supply chain: Supply chain is defined as there is a chain between from raw material…
Q: Increase the amount of special sauce available by 1 ounce and re-solve. Does the solution confirm…
A: We reproduce the Excel as shown below: We solve the problem using Excel Solver as shown in the…
Q: Select the best answer for the question. 2. The carrying cost for inventory consists of which cost…
A: Inventory carrying costs are the costs incurred to carry forward extra units produced and not sold…
Q: What are burn up charts and burn down charts? Describe when you would use a burn up chart versus a…
A: Managers utilize burn-up as well as burn-down charts to monitor the situation with the project.…
Q: Given the following historical data, what is the simple three-period moving average forecast for…
A: 3-period moving average forecast is calculated the sum of last three period and divided by 3 .
Q: A 20 16 B 11 # D E F 14 23 14 19 H 14 10 11 K 18 23 21 M Note: This question requires Solver.…
A: Operation management is performed in each manufacturing organization. It all deals with the…
Q: At a border inspection station, vehicles arrive at the rate of 10 per hour in a Poisson…
A:
Q: The wheat harvesting season in the American Midwest is short, and farmers deliver their truckloads…
A: From the given question description, the following information is extracted. Arrival rate λ = 31…
Q: A company is planning on launching a new product. It was thinking of launching in June of next year,…
A: Find the Given details below: Given details: High Medium Low Beats the rival 0.6 0.25 0.15…
Q: 2) A software developer has four project proposals for new accounting software. This company cannot…
A: Given data is Project Programmers req Capital req ($) Returns ($) 1 7 250,000 650,000 2 9…
Q: I What is the bullwhip effect and how does it relate to lack of coordination in the supply chain?
A: The bullwhip effect occurs in distribution channels when supply chain inefficiencies are caused by…
Q: Mishap has a gross income of $43,360. She owns a condominium and donates to charity, but there's no…
A: Ans) In the statement of question, it is clearly written that no way her tax deductible expenses…
Q: a) What is the value of your forecast? The value of the forecast is patients (round your response to…
A: Forecasting is a technique used to predict future outcomes on the basis of past data. In businesses…
Q: What is the BEST source of lighting for a web conference? O an uncovered window behind you O a soft…
A: Web conferences means meeting virtually using laptop or desktop with web cam on. Communication is…
Q: 1- A sourcing strategy for items in the leverage quadrant will be to build long-term alliances with…
A: Ans) 1) A sourcing strategy for items in the leverage quadrant do not means to build long term…
Q: #2 2. A project has the following cash flows: Two Three years years from from now Now -$4 million…
A: The detailed solution is given in Step 2
Q: What role does inventory management play in an overall business plan and describe the benefits of…
A: *As per guidelines in multiple questions first one is answerable.The inventory management process in…

Step by step
Solved in 2 steps with 3 images

- A trucking company wants to predict the yearly maintenance expense (Y) for a truck using the number of miles driven during the year (X1) and the age of the truck (X2, in years) at the beginning of the year. The company has gathered the data given in the file P13_13.xlsx. Note that each observation corresponds to a particular truck. Estimate a multiple regression equation using the given data. Interpret each of the estimated regression coefficients. Also, interpret the standard error of estimate and the R-square value for these data.The management of a technology company is trying to determine the variable that best explains the variation of employee salaries using a sample of 52 full-time employees; see the file P13_08.xlsx. Estimate simple linear regression equations to identify which of the following has the strongest linear relationship with annual salary: the employees gender, age, number of years of relevant work experience prior to employment at the company, number of years of employment at the company, or number of years of post secondary education. Provide support for your conclusion.A small computer chip manufacturer wants to forecast monthly ozperating costs as a function of the number of units produced during a month. The company has collected the 16 months of data in the file P13_34.xlsx. a. Determine an equation that can be used to predict monthly production costs from units produced. Are there any outliers? b. How could the regression line obtained in part a be used to determine whether the company was efficient or inefficient during any particular month?
- An antique collector believes that the price received for a particular item increases with its age and with the number of bidders. The file P13_14.xlsx contains data on these three variables for 32 recently auctioned comparable items. Estimate a multiple regression equation using the given data. Interpret each of the estimated regression coefficients. Is the antique collector correct in believing that the price received for the item increases with its age and with the number of bidders? Interpret the standard error of estimate and the R-square value for these data.Management of a home appliance store would like to understand the growth pattern of the monthly sales of Blu-ray disc players over the past two years. Managers have recorded the relevant data in the file P13_33.xlsx. a. Create a scatterplot for these data. Comment on the observed behavior of monthly sales at this store over time. b. Estimate an appropriate regression equation to explain the variation of monthly sales over the given time period. Interpret the estimated regression coefficients. c. Analyze the estimated equations residuals. Do they suggest that the regression equation is adequate? If not, return to part b and revise your equation. Continue to revise the equation until the results are satisfactory.The Baker Company wants to develop a budget to predict how overhead costs vary with activity levels. Management is trying to decide whether direct labor hours (DLH) or units produced is the better measure of activity for the firm. Monthly data for the preceding 24 months appear in the file P13_40.xlsx. Use regression analysis to determine which measure, DLH or Units (or both), should be used for the budget. How would the regression equation be used to obtain the budget for the firms overhead costs?
- Do the sales prices of houses in a given community vary systematically with their sizes (as measured in square feet)? Answer this question by estimating a simple regression equation where the sales price of the house is the dependent variable, and the size of the house is the explanatory variable. Use the sample data given in P13_06.xlsx. Interpret your estimated equation, the associated R-square value, and the associated standard error of estimate.Stock market analysts are continually looking for reliable predictors of stock prices. Consider the problem of modeling the price per share of electric utility stocks (Y). Two variables thought to influence this stock price are return on average equity (X1) and annual dividend rate (X2). The stock price, returns on equity, and dividend rates on a randomly selected day for 16 electric utility stocks are provided in the file P13_15.xlsx. Estimate a multiple regression equation using the given data. Interpret each of the estimated regression coefficients. Also, interpret the standard error of estimate and the R-square value for these data.The file P13_02.xlsx contains five years of monthly data on sales (number of units sold) for a particular company. The company suspects that except for random noise, its sales are growing by a constant percentage each month and will continue to do so for at least the near future. a. Explain briefly whether the plot of the series visually supports the companys suspicion. b. By what percentage are sales increasing each month? c. What is the MAPE for the forecast model in part b? In words, what does it measure? Considering its magnitude, does the model seem to be doing a good job? d. In words, how does the model make forecasts for future months? Specifically, given the forecast value for the last month in the data set, what simple arithmetic could you use to obtain forecasts for the next few months?
- The file P13_28.xlsx contains monthly retail sales of U.S. liquor stores. a. Is seasonality present in these data? If so, characterize the seasonality pattern. b. Use Winters method to forecast this series with smoothing constants = = 0.1 and = 0.3. Does the forecast series seem to track the seasonal pattern well? What are your forecasts for the next 12 months?The owner of a restaurant in Bloomington, Indiana, has recorded sales data for the past 19 years. He has also recorded data on potentially relevant variables. The data are listed in the file P13_17.xlsx. a. Estimate a simple regression equation involving annual sales (the dependent variable) and the size of the population residing within 10 miles of the restaurant (the explanatory variable). Interpret R-square for this regression. b. Add another explanatory variableannual advertising expendituresto the regression equation in part a. Estimate and interpret this expanded equation. How does the R-square value for this multiple regression equation compare to that of the simple regression equation estimated in part a? Explain any difference between the two R-square values. How can you use the adjusted R-squares for a comparison of the two equations? c. Add one more explanatory variable to the multiple regression equation estimated in part b. In particular, estimate and interpret the coefficients of a multiple regression equation that includes the previous years advertising expenditure. How does the inclusion of this third explanatory variable affect the R-square, compared to the corresponding values for the equation of part b? Explain any changes in this value. What does the adjusted R-square for the new equation tell you?The file P13_26.xlsx contains the monthly number of airline tickets sold by the CareFree Travel Agency. a. Create a time series chart of the data. Based on what you see, which of the exponential smoothing models do you think will provide the best forecasting model? Why? b. Use simple exponential smoothing to forecast these data, using a smoothing constant of 0.1. c. Repeat part b, but search for the smoothing constant that makes RMSE as small as possible. Does it make much of an improvement over the model in part b?