Use a Standard normal distribution table to find the percent of the total under the standard normal curve between the following Z scores. Z equals 0.5 and z equals 1.2 The percent of the total area between Z equals 0.55 and see equal 1.2 is % (Round to the nearest integer)
Use a Standard normal distribution table to find the percent of the total under the standard normal curve between the following Z scores. Z equals 0.5 and z equals 1.2 The percent of the total area between Z equals 0.55 and see equal 1.2 is % (Round to the nearest integer)

Big Ideas Math A Bridge To Success Algebra 1: Student Edition 2015
1st Edition
ISBN:9781680331141
Author:HOUGHTON MIFFLIN HARCOURT
Publisher:HOUGHTON MIFFLIN HARCOURT
Chapter11: Data Analysis And Displays
Section11.3: Shapes Of Distributions
Problem 8Q

Related questions
Question
Use a Standard normal distribution table to find the percent of the total under the standard normal curve between the following Z scores. Z equals 0.5 and z equals 1.2
The percent of the total area between Z equals 0.55 and see equal 1.2 is %
(Round to the nearest integer)
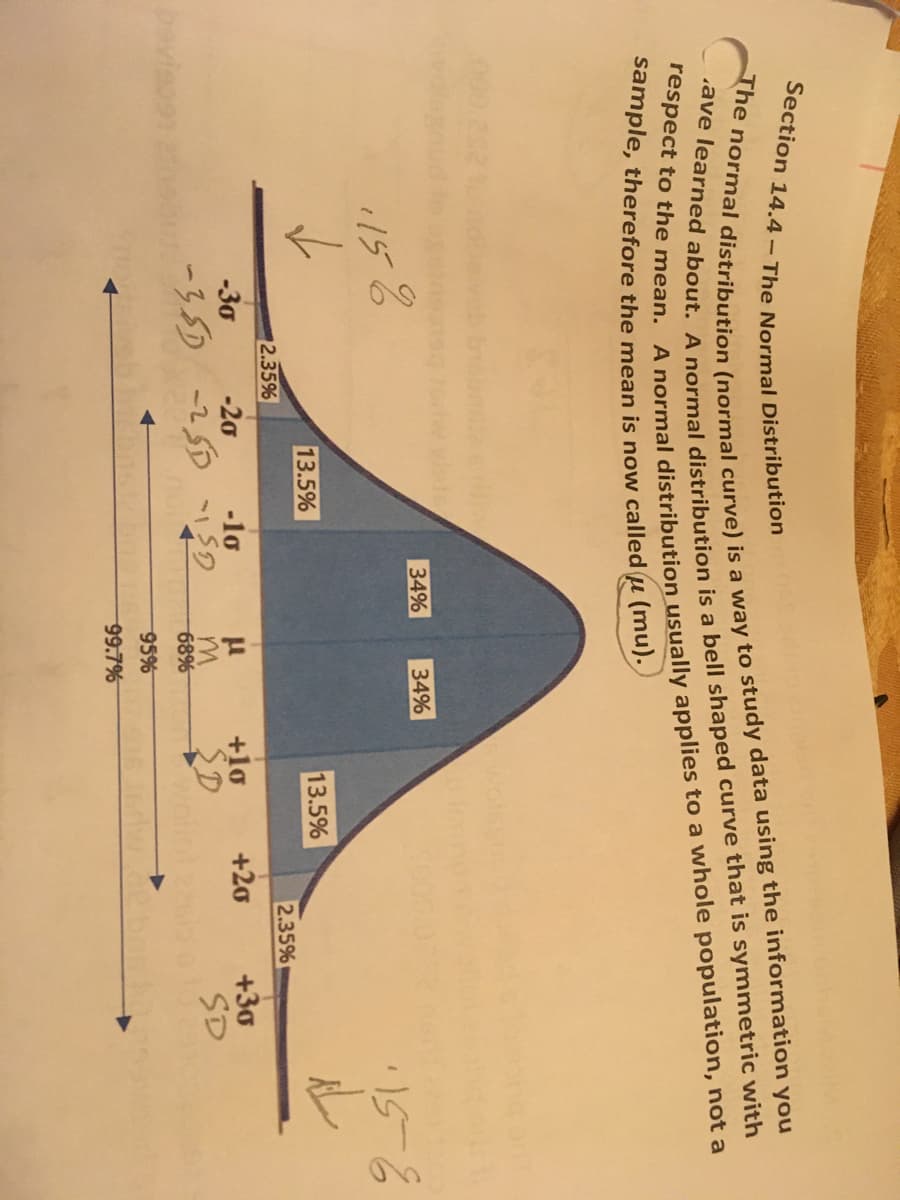
Transcribed Image Text:Section 14.4- The Normal Distribution
The normal distribution (normal curve) is a way to study data using the information you
.ave learned about. A normal distribution is a bell shaped curve that is symmetric with
respect to the mean. A normal distribution usually applies to a whole population, not a
sample, therefore the mean is now called u (mu).)
34%
34%
1158
15-6
2.35%
-30
-20
-10
-35D -25D ISD
13.5%
m
68%
95%
99.7%
13.5%
+1o
SD
+20
2.35%
+30
SD
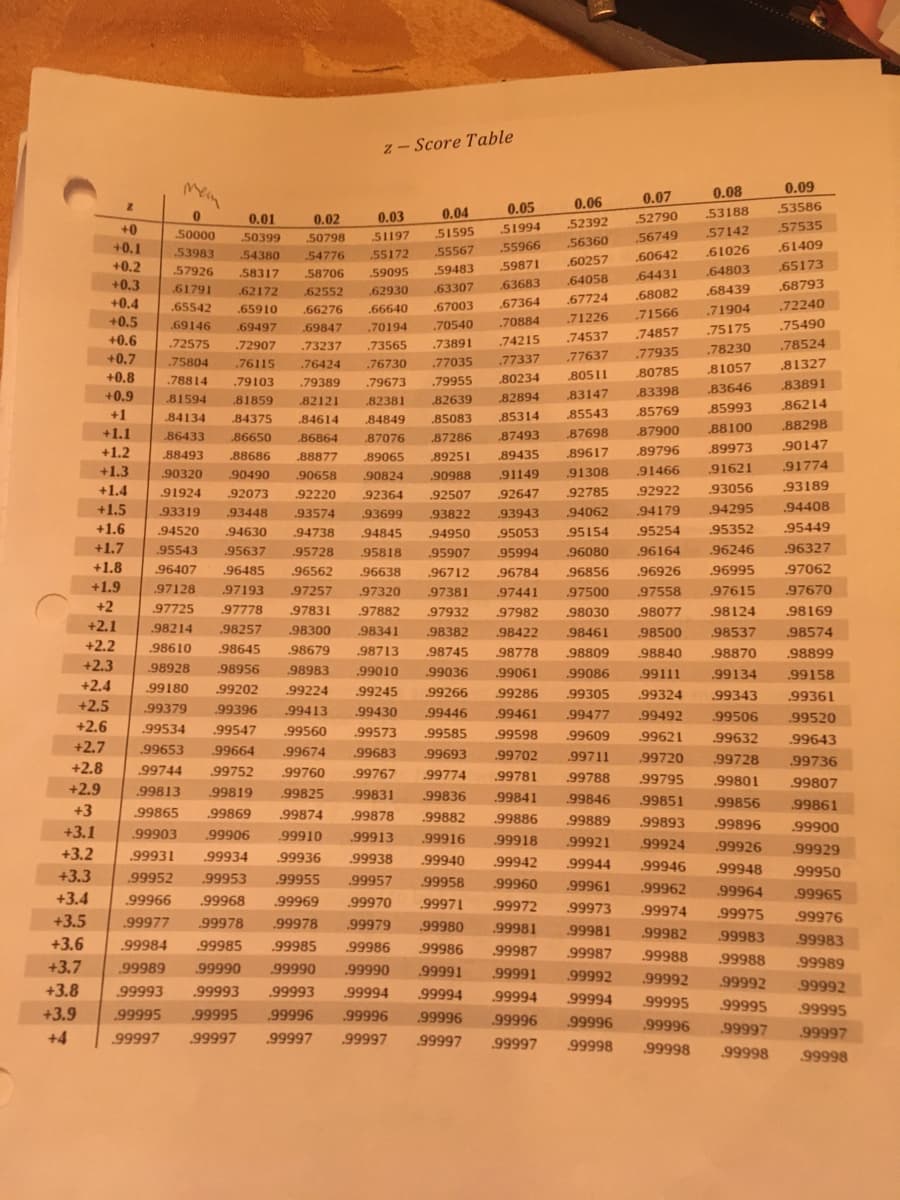
Transcribed Image Text:z - Score Table
0.07
0.08
2
0.05
0.06
0
0.01
0.02
0.04
0.03
53188
52790
52392
+0
51994
50000 50399
50798
51595
51197
57142
56749
+0.1
56360
53983
55966
.54380
.54776
55567
55172
61026
.60642
+0.2
57926
60257
59871
58317
.58706
59483
59095
64431
.64803
+0.3
61791
64058
63683
.62172
.62552
63307
62930
.68082
68439
+0.4
.67724
.65542 .65910
.67364
.66276
.66640
.67003
.71566
.71904
+0.5
.71226
69146 69497
.69847
.70884
.70194
.70540
74857
.75175
+0.6
.72575
.74537
.72907 .73237
.74215
.73565
.73891
.78230
+0.7
.77935
.75804 .76115
.77637
.76424
.76730
.77337
.77035
+0.8
81057
80785
80511
.78814 .79103
.79389
.79673
.79955
80234
83646
+0.9
83398
81594 .81859
82121
83147
.82381
82639
82894
+1
85769
85543
85993
.84134
84849
85314
85083
88100
+1.1
.86433 .86650
.84375 .84614
.86864 .87076
.88877 .89065 .89251
87900
87286
87493
87698
+1.2
88493
89973
.88686
89435
89617
89796
+1.3
90320
91621
.90490
90658
.90824 90988
91149 91308
.91466
+1.4
91924
.92073
93056
92220
.92364 92507
92647
.92785
.92922
+1.5
.93319
.93448
.93574
93822
.93699
.93943
.94062
.94179
94295
+1.6
94520
94630
.94738
.94950
95053
95154
95254
95352
+1.7 .95543
96164 .96246
+1.8
95637 95728
96407 .96485
97128 .97193
94845
95818 .95907
96638 .96712
.97320 97381
97932
.95994 .96080
.96784 .96856 .96926 .96995
96562
+1.9
97257
.97441 .97500 97558
.97615
+2
97725
.97778
97831
97882
97982
.98030
98077
.98124
+2.1
98214 98257 .98300
98341
98382
.98422
.98461
98500 .98537
+2.2
98713
.98745
98778
98809
98840
98870
+2.3
98679
98983 .99010
.99245
99036
.99061
98610 98645
98928 .98956
.99180
.99379 .99396
.99086
99111
.99134
+2.4
99266
99286
.99305
99324
99343
+2.5
.99446
.99461 .99477 .99492
.99413 99430
.99573
99506
+2.6
99585
99598
99609
99621
99632
+2.7
.99653 .99664
.99534 .99547 99560
.99674
.99752 .99760
.99683
99693
99702
99711
.99720
99728
+2.8
99744
99767 .99774
99781
99788
99795
99801
+2.9
.99813
99819
.99825
.99831 .99836
.99841 .99846
99851
99856
+3
99865
.99869
99874 99878
99882
99886
99889
.99893
99896
+3.1 .99903
.99906
99916
99918
99921
.99924
99926
+3.2 .99931
.99940 .99942
99944
99946
99948
+3.3
99960 .99961
.99962
99964
+3.4
99973
99974
99975
+3.5
99910 .99913
99934
99936 99938
99952 .99953 .99955 .99957 99958
.99966 99968 99969 .99970 .99971 99972
.99977 .99978 .99978 .99979 .99980 .99981
.99984 99985 .99985 99986 99986 .99987
99989 99990 99990
.99991
+3.8
99993 .99993
+3.9 .99995 99995
+4
99981
99982 99983
+3.6
99987
99988
99988
+3.7
99992
.99990 .99991
.99993 .99994 99994
.99992 99992
99994
99994
99995 99995
.99996 .99996 99996
99996
99996 99996
99997
99997 .99997 99997 99997
99997
99997
99998
99998
99998
.99202 99224
0.09
53586
57535
61409
.65173
.68793
.72240
.75490
.78524
81327
83891
86214
.88298)
90147
91774
93189
.94408
95449
.96327
97062
.97670
.98169
98574
98899
.99158
.99361
.99520
99643
99736
99807
.99861
.99900
99929
99950
99965
99976
99983
99989
99992
99995
99997
99998
Expert Solution
This question has been solved!
Explore an expertly crafted, step-by-step solution for a thorough understanding of key concepts.

Step by step
Solved in 3 steps with 2 images

Recommended textbooks for you
Big Ideas Math A Bridge To Success Algebra 1: Stu…
Algebra
ISBN:
9781680331141
Author:
HOUGHTON MIFFLIN HARCOURT
Publisher:
Houghton Mifflin Harcourt

Algebra & Trigonometry with Analytic Geometry
Algebra
ISBN:
9781133382119
Author:
Swokowski
Publisher:
Cengage

Glencoe Algebra 1, Student Edition, 9780079039897…
Algebra
ISBN:
9780079039897
Author:
Carter
Publisher:
McGraw Hill
Big Ideas Math A Bridge To Success Algebra 1: Stu…
Algebra
ISBN:
9781680331141
Author:
HOUGHTON MIFFLIN HARCOURT
Publisher:
Houghton Mifflin Harcourt
Algebra & Trigonometry with Analytic Geometry
Algebra
ISBN:
9781133382119
Author:
Swokowski
Publisher:
Cengage
Glencoe Algebra 1, Student Edition, 9780079039897…
Algebra
ISBN:
9780079039897
Author:
Carter
Publisher:
McGraw Hill