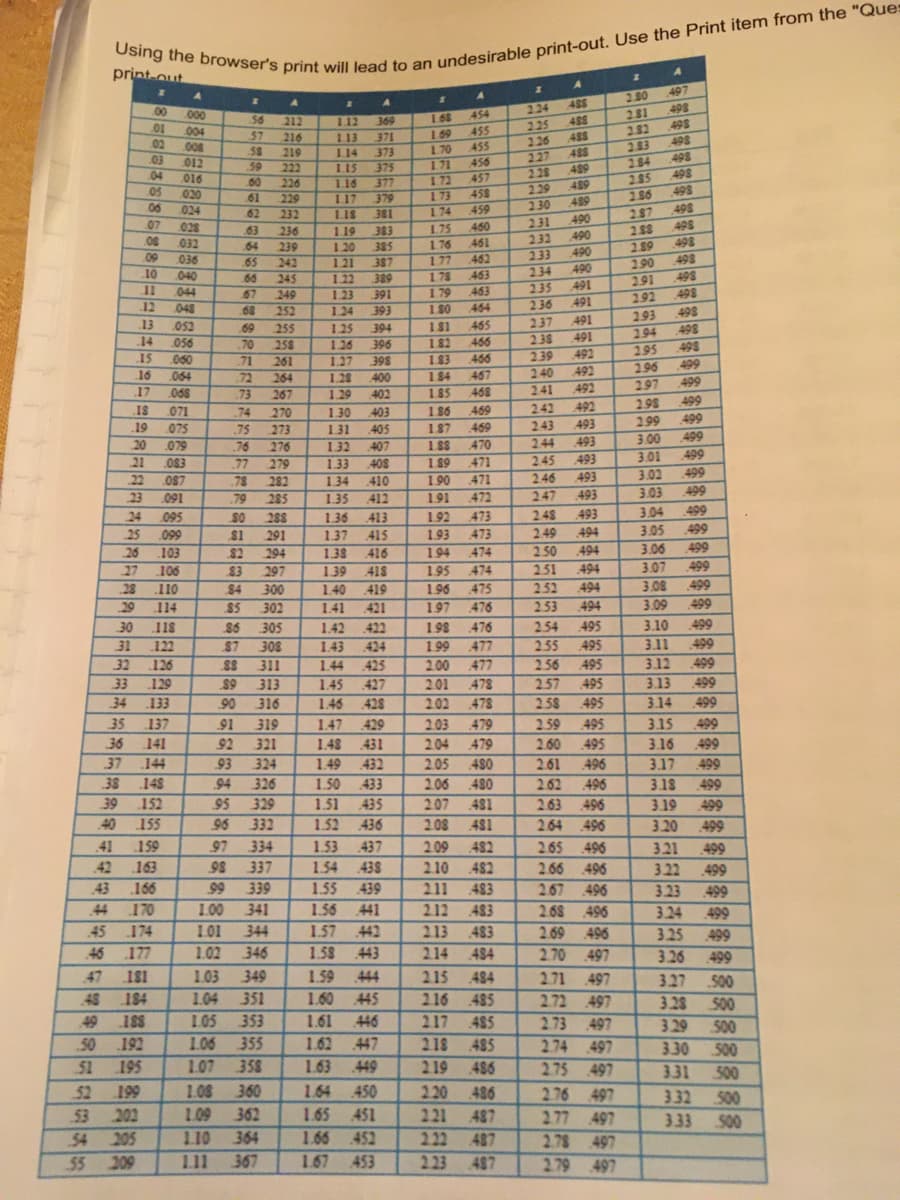
Use a standard normal distribution table to find the percentage of area above the standard normal curve that is specified. Above z Equal 1.49 What is the percentage off the area above z equal 1.49? (Round to the nearest tenth as needed
Q: he expected value of g(X,Y) = XY. Determine the covariance of X and Y. Determin
A: x f(x,y) 1 2 3 h(y) y 1 0.05 0.05 0.1 0.2 2 0.05 0.1 0.35 0.5 3 0 0.2 0.1 0.3 g(x)…
Q: The Intelligence Quotient (IQ) test scores for adults are normally distributed with a population…
A: Solution-: Given: μ=100,σ=20,n=70 We want to find, P(the mean of sample less than 95)=?
Q: A researcher theorizes that there is a linear relationship between the number of pets a person owns…
A:
Q: The table below gives the annual income for eight families, in thousands of dollars. Find the number…
A: Given : Family A B C D E F G H Income 51 53 52 50 49 50 47 48
Q: A binomial experiment with probability of success p=0.4 and n=5 trials is conducted. What is the…
A:
Q: Q1/ Grades in statistics class are weighted as follows: Tests are worth 50% of grade, homework is…
A: Given information: Weights given, Test (W1)=50%Homework (W2)=30%Final (W3)=20%Marks obtained, Test…
Q: X f(x, y) 2 4 1 0.10 0.15 Y 3 0.20 0.30 5 0.10 0.15 c. Determine the cumulative distribution…
A: Solution-: We have following joint probability distribution table: f(x,y) x 2 4 y 1 0.10…
Q: ence interval using a 99% confidence level. What does the idence interval tell about the population…
A:
Q: µ = 3, o² = 9, P(−6 < X <12) a. Determine P(µ − ko < X < µ+ ko) ≥ 1 − 1/k²
A: The question is about Chebyshev's inequality Given : μ = 3 σ2 = 9 So, σ = 3 .... by taking square…
Q: State the null and alternative hypotheses for a hypothesis test; indicate whether the hypothesis…
A: Explanation: Null hypothesis is a statement about a population parameter, such as the population…
Q: A daily lottery is conducted in which 4 winning numbers are selected out of 59 numbers (without…
A: Given that, No. of winning numbers, r = 4 Total no. of numbers, n = 59 The formula for calculating…
Q: The following data represent the number of grams of fat in breakfast meals offered at a local fast…
A:
Q: A study investigated the impact of sleep deprivation on academic performance in university medical…
A:
Q: 4. x = 81.72 μ = 79.83 s = 15 n = 29 5. X = 70 μ = 71.5 s = 8 n = 10
A: Formula : Test statistic
Q: μ=3₂ = 9, P(-6 12) a. Determine P(u - ko < X <u+ko) ≥ 1-1/2²
A:
Q: 3/4 $1 1/4 1/4 82 11/3
A: The states in the Markov Chain are: s1 s2 s3 f(s1) = Af(s2) = Bf(s3) = C s1…
Q: The UWI Open Campus has commissioned a study to determine how student will perform in ECON3080 based…
A: The UWI Open Campus has commissioned a study to determine how student will perform in ECON3080 based…
Q: X f(x, y) 2 4 1 0.10 0.15 y 0.20 0.30 3 5 0.10 0.15 a. Determine the marginal distribution g(x), x =…
A: Given Information: f(x,y) x 2 4 1 0.10 0.15 y 3 0.20 0.30 5 0.10 0.15
Q: Round your answer for the expected count to one decimal place, and your answer for the contribution…
A: Given,
Q: Example1: For the values of (8, 3, 5, 12, 10) find the arithmetic mean .
A:
Q: 1) Researchers are curious whether the age a couple gets married affects the number of children they…
A: From the given information, x1 be the father's age at marriage , x2 be the mother's age at marriage…
Q: A population of values has a normal distribution with μ=153.4μ=153.4 and σ=7.9σ=7.9. You intend to…
A:
Q: Discuss the cause of Heteroskedasticity in regression analysis
A: . Heteroskedasticity: It shows unequal variability in the predictor variables. Cause of occurrence…
Q: 5. μ=3, o² = 9, P(−6 < X < 12) a. Determine P(µ − ko < X < µ+ ko) ≥ 1 − 1/k²
A: Given Population mean μ=3, Population variance σ2=9 Find P(-6<X<12)=?
Q: The following is a set of data from a sample of n=6. 5 2 7 5 1 13 a. Compute the first…
A:
Q: The time in hours during which an electrical generator is operational is a random variable that…
A: Given : Population Mean,μ = 160
Q: Mr. A, an owner of a particular softdrink brand claims that the average capacity of their product is…
A:
Q: A class of 18 pupils consist of 11 girls, 4 of whom are left-handed, and 7 boys, only one of whom…
A: Given Girl=11 G=4 (left handed) Boy=7 B=1 (left handed)
Q: probabilities are 0.94, 0.91, 0.97 and 0.94, respectively, for machines 1, 2, 3 and 4. (a) A…
A: "Since you have posted a question with multiple sub-parts, we'll solve the first three. To get the…
Q: A particular brand of women's jeans is available in eight different sizes, four different colors,…
A: Solution-: Given: Number of different sizes =8 Number of different colors=4 Number of different…
Q: (a) Determine the probability P (1 or fewer). Rou
A: Let X denote number of successes. Given that X follows Binomial(n = 8, p = 0.5).
Q: A student was asked to find a 90% confidence interval for widget width using data from a random…
A:
Q: KRUSKALL WALLIS (THREE OR MORE INDEPENDENT SAMPLES) In an experiment to determine which of three…
A: Given information: CS1 CS2 CS3 23 21.2 17.4 17.7 20.8 20.1 21.8 17.1 16.3 20.8 18.6 16.3…
Q: A random sample of 60 patients was selected for an experimental treatment of temporomandibular (jaw)…
A: Given Data n = 60 x = 24
Q: The numbers of regular season wins for 10 football teams in a given season are given below.…
A: a) from the given data maximum number =15 minimum number=2
Q: Suppose the distribution of scores of 1000 students who take a standardized intelligence test is a…
A: Given: n = 1000 μ = 450 σ = 35
Q: In 1945, an organization asked 1504 randomly sampled American citizens, "Do you think we can develop…
A: Given data number of success , x= 792 sample size, n =1504 population…
Q: Based on the information, what is the cumulative relative frequency for the 50.2% - 59.7% change in…
A: It is given that Cumulative frequency for class 50.2-59.7 is = 45 Total frequency = 50
Q: X 2 1 0.05 0.05 0.05 0.10 0.00 0.20 g (x) 0.10 0.35 e. Determine the standard deviation of X. f.…
A: Marginal density function of X is X 1 2 3 g(x) 0.10 0.35 0.55 Marginal density…
Q: 1. Calculate the mean, variance (s²), standard deviation (s), z-scores, and t-scores of the…
A:
Q: f(x, y) = = {x² +0<x< 1,0 <y < 2, 0,. elsewhere. g(x)= 2x (x + 1/3), h(y)= 1/3 + y/6. b. a.…
A:
Q: Is there a significant difference between the youth who favour lower legal drinking age from the…
A: Here From given information Claim : 40% of the youth in a city are favor of lower legal drinking age…
Q: √x² +²23,0 < x < 1,0 < y < 2, f(x, y) = elsewhere. 0, b. g(x) = 2x (x + 1/3), h(y) = 1/3 + y/6. a.…
A: E(XY)=∫y∫xxy.f(x,y)dxdy
Q: O a Sun Jun 19 10:03 PM ●●● M Inbox (2) - cjohnson@rcs137. X + Chrome File Edit View History…
A:
Q: hich value of r indicates a stronger correlation: r=0.752 or r= -0.857? Explain your reasoning.…
A:
Q: )The standard error of the difference between the sample means ins
A: The 9 tuataras measured at location A had a mean mass of 617.7 g with a standard deviation of 38.67…
Q: 1. A spot speed study for 250 vehicles was conducted at Taman Universiti. The result yields average…
A:
Q: The following is a set of data from a sample of n=5. 13 9 12 5 1 (a) Compute the first…
A: The answer is attached below,
Q: A Survey among Seniors revealed that the number of hours spent Studying the week before final exams…
A: Given Mean=25 Standard deviations=7
Q: a. Determine the expected value of X. b. Determine the expected value of Y. c. Determine the…
A:
Trending now
This is a popular solution!
Step by step
Solved in 2 steps with 2 images
- What is a sample space?The median number of part-time employees at fast-food restaurants in a particular city wasknown to be 18 last year. City officials think the use of part-time employees may be increasing.A sample of nine fast-food restaurants showed that seven restaurants were employing morethan 18 part-time employees, one restaurant was employing exactly 18 part-time employees,and one restaurant was employing fewer than 18 part-time employees. Can it be concludedthat the median number of part-time employees has increased? Test using a = .05.A warehouse manager wants to know if there is an association between the shift worked and being on time for work. To investigate, he selects a random sample of 70 workers and classifies each one according to the shift they worked most recently and whether they were on time for work. He was unable to classify a substantial number of people as being on time, so he classified those individuals as unknown. The data are displayed in the table. The manager would like to know if these data provide convincing evidence of an association between the shift worked and being on time in the large population of all workers at this warehouse. The random and 10% conditions are met. Is the Large Counts condition met? Yes, the smallest expected count is 5, so all expected counts are at least 5. Yes, the smallest expected count is 8.54, so all expected counts are at least 5. No, the smallest expected count is 2.56, so the expected counts are not all at least 5. No, the smallest expected count is…
- The median number of part-time employees at fast-food restaurants in a particular city wasknown to be 18 last year. City officials think the use of part-time employees may be increasing. A sample of nine fast-food restaurants showed that seven restaurants were employing more than 18 part-time employees, one restaurant was employing exactly 18 part-time employees, and one restaurant was employing fewer than 18 part-time employees. Can it be concluded that the median number of part-time employees has increased? Test using α = 0.05A nationwide job recruiting firm wants to compare the annual incomes for childcare workers in Texas and Indiana. Due to recent trends in the childcare industry, the firm suspects that the mean annual income of childcare workers in Texas is less than the mean annual income of childcare workers in Indiana. To see if this is true, the firm selected a random sample of 20 childcare workers from Texas and an independent random sample of 20 childcare workers from Indiana and asked them to report their mean annual income. The data obtained were as follows. Annual income in dollars Texas 37093 , 33960 , 35692 , 29528 , 30978 , 35504 , 26961 , 28380 , 37537 , 25341 , 34837 , 36489 , 33633 , 41229 , 43577 , 27644 , 43364 , 28415 , 28919 , 34096 Indiana 33672 , 46452 , 35900 , 28486 , 46528 , 34252 , 40952 , 42164 , 36298 , 38828 , 32690 , 29157 , 42770 , 35527 , 40804 ,…A cell phone company knows that the mean length of calls for all of its customers in a certain city is 9.3 minutes. The company is thinking about offering a senior discount to attract new customers, but only wants to do so if the mean length of calls for current customers who are seniors (65 and over) is lower than it is for the general customer pool. The only way to identify seniors is to conduct a survey and ask people whether they are over age 65. Using this method, the company contacts a random sample of 100 seniors and records the length of their last call. The sample mean and standard deviation for the 100 calls are 8.2 minutes and 10 minutes, respectively. (a) Do you think the data collected on the 100 seniors are approximately bell-shaped? Explain. Bell-shaped data would range from about standard deviation(s) below the mean to standard deviation(s) above the mean. With a mean of 8.2 minutes and standard deviation of 10, the values in this range are possible…
- Ashik is planning to propose to a girl he has a crush on in a grand way. He has decided to create an animation movie, conveying his love to his crush and he needs to estimate the total production time (labor-hours necessary) to produce the movie. Since he is so rich, he wants to use multiple big screens to project the movie and the mean production time for a random sample of 14 big-screen animated movie is found to be 53,500 labor-hours. Suppose that Ashik has managed to find out that the population standard deviation is 7462 labor-hours and the distribution of the production time is normal. 10 Construct a 98% confidence interval for the mean production time to produce a big-screen animated movieA psychologist is interested in determining if the proportion of males who are diagnosed with depression during their first year away from home is different from the proportion of females diagnosed with depression their first year. She thinks that females are more emotionally unstable than males and feels like school programs need to target females more effectively. She conducts a study and randomly samples 300 males and 250 females. Of the males, 30 are diagnosed with depression, and of the females, 50 are diagnosed with depression. Is there enough evidence to support the researcher’s hypothesis?I have the first two parts but can someone help find the claim at 0.01 significance level? Thanks!
- As part of their efforts, the executives also surveyed managers across the country to determinestaffing shortages. Managers were encouraged, but not required, to submit the survey. From theresponses they received, 45 out of 52 managers said they were either “severely understaffed” or“understaffed.” Looking at the numbers, one of the executives is outraged. “How can we expect ourstores to be successful if almost 87% are understaffed?” Give a statistical response tothe executive to assure them that the staffing problem is probably not as bad as it seemsin the preliminary numbers.the HR Office is trying to choose who will be retained among the employees. The portfolio of each was given to the HR Director. For each employee, the HR Director gathers information by trying to verify the years in service, expertise, qualifications, performance evaluation, etc. but some doubt about who among the employees are qualified always remains when a decision to retain or not is to be made. What are the type I and II decision error costs? Which decision error is more likely to be discovered by her boss? How does this affect the HR Director’s decisions on employee retention?In a recent study; it was found that 62 percent of college students drink heavily and drive. Assuming all conditions are met, a police chief wanting to enact an emergency protocol for DWI/DUI wants to know if the claim is accurate. He took a sample of 70 college students who drank and drove and found that 46 of those students had a high blood alcohol level. Can we claim that more than 62 percent of all college students drink heavily and drive?