Use a t-test to test the claim about the population mean u at the given level of significance a using the given sample statistics. Assume the population is normally distributed. Claim: u=51,400; a = 0.01 Sample statistics: x = 52,761, s= 2600, n= 17 Click the icon to view the t-distribution table. What are the null and altemative hypotheses? Choose the correct answer below. O A. Ho: us 51,400 Hi u> 51,400 O B. Hoi H#51,400 Hu= 51,400 OD. Ho: H= 51,400 H u#51,400 O C. H μ251,400 Hu<51,400
Use a t-test to test the claim about the population mean u at the given level of significance a using the given sample statistics. Assume the population is normally distributed. Claim: u=51,400; a = 0.01 Sample statistics: x = 52,761, s= 2600, n= 17 Click the icon to view the t-distribution table. What are the null and altemative hypotheses? Choose the correct answer below. O A. Ho: us 51,400 Hi u> 51,400 O B. Hoi H#51,400 Hu= 51,400 OD. Ho: H= 51,400 H u#51,400 O C. H μ251,400 Hu<51,400

Glencoe Algebra 1, Student Edition, 9780079039897, 0079039898, 2018
18th Edition
ISBN:9780079039897
Author:Carter
Publisher:Carter
Chapter10: Statistics
Section10.4: Distributions Of Data
Problem 19PFA

Related questions
Question
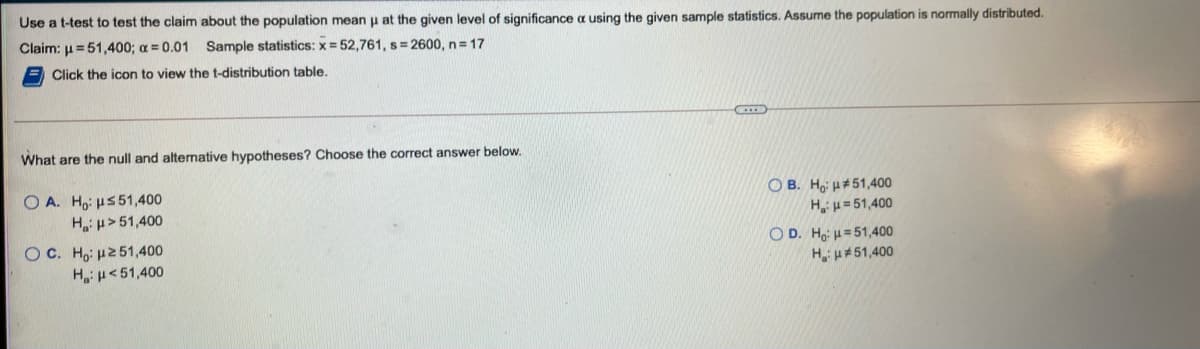
Transcribed Image Text:Use a t-test to test the claim about the population mean u at the given level of significance a using the given sample statistics. Assume the population is normally distributed.
Claim: u=51,400; a = 0.01
Sample statistics: x = 52,761, s= 2600, n= 17
Click the icon to view the t-distribution table.
What are the null and altemative hypotheses? Choose the correct answer below.
O A. Ho: u5 51,400
Hi µ > 51,400
OC. Ho: H251,400
O B. Hoi H#51,400
H,u= 51,400
OD. Ho: H= 51,400
H u#51,400
H:u<51,400
Expert Solution
This question has been solved!
Explore an expertly crafted, step-by-step solution for a thorough understanding of key concepts.

Step by step
Solved in 2 steps with 2 images

Recommended textbooks for you
Glencoe Algebra 1, Student Edition, 9780079039897…
Algebra
ISBN:
9780079039897
Author:
Carter
Publisher:
McGraw Hill
Glencoe Algebra 1, Student Edition, 9780079039897…
Algebra
ISBN:
9780079039897
Author:
Carter
Publisher:
McGraw Hill