Use Excel to create a fully labelled line graph to show the total number of recorded offences in each year from 2013/14 to 2022/23. Take a screenshot of your chart or graph and insert it.
Use Excel to create a fully labelled line graph to show the total number of recorded offences in each year from 2013/14 to 2022/23. Take a screenshot of your chart or graph and insert it.

Algebra & Trigonometry with Analytic Geometry
13th Edition
ISBN:9781133382119
Author:Swokowski
Publisher:Swokowski
Chapter10: Sequences, Series, And Probability
Section10.2: Arithmetic Sequences
Problem 52E

Related questions
Question
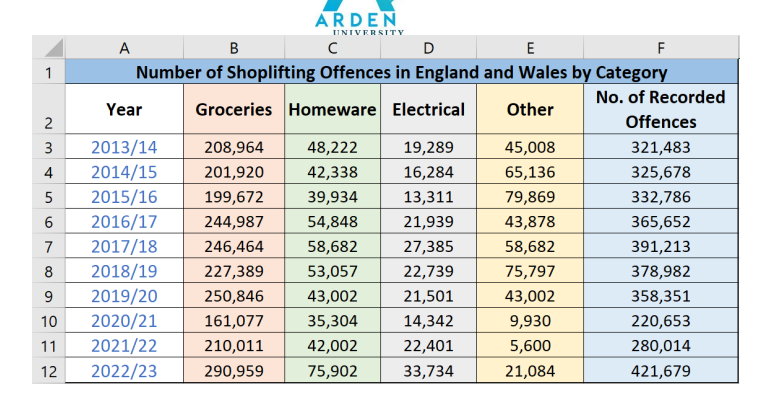
Use Excel to create a fully labelled line graph to show the total number of recorded offences in each year from 2013/14 to 2022/23. Take a screenshot of your chart or graph and insert it.
Transcribed Image Text:1
A
2
3
4
Year
2013/14
2014/15
5
2015/16
6 2016/17
7 2017/18
8
2018/19
9 2019/20
10
2020/21
с
D
E
F
Number of Shoplifting Offences in England and Wales by Category
Groceries Homeware Electrical
Other
208,964 48,222
19,289
45,008
201,920
42,338
16,284
65,136
199,672
13,311
79,869
244,987
43,878
246,464
58,682
227,389
75,797
250,846
43,002
161,077
9,930
210,011
5,600
290,959
21,084
B
11 2021/22
12
2022/23
ARDEN
UNIVERSITY
39,934
54,848
58,682
53,057
43,002
35,304
42,002
75,902
21,939
27,385
22,739
21,501
14,342
22,401
33,734
No. of Recorded
Offences
321,483
325,678
332,786
365,652
391,213
378,982
358,351
220,653
280,014
421,679
Expert Solution
This question has been solved!
Explore an expertly crafted, step-by-step solution for a thorough understanding of key concepts.

Step by step
Solved in 3 steps with 3 images

Recommended textbooks for you
Algebra & Trigonometry with Analytic Geometry
Algebra
ISBN:
9781133382119
Author:
Swokowski
Publisher:
Cengage

Elementary Linear Algebra (MindTap Course List)
Algebra
ISBN:
9781305658004
Author:
Ron Larson
Publisher:
Cengage Learning
Algebra & Trigonometry with Analytic Geometry
Algebra
ISBN:
9781133382119
Author:
Swokowski
Publisher:
Cengage
Elementary Linear Algebra (MindTap Course List)
Algebra
ISBN:
9781305658004
Author:
Ron Larson
Publisher:
Cengage Learning