Use for financial statements for Yellow Hammer to answer problems 1-3 L. Assess Yellow Hammer's income statement by calculating the sales growth, EBITDA profitability (EBITDA/Sales) and coverage ratios using EBIT and EBITDA for each year. 2. Assess Yellow Hammer's balance sheet by calculating the leverage ratios using of Debt/Capitalization and Debt/EBITDA. 3. Using the table below and the ratios that you've calculated, insert the EBIT interest coverage, EBITDA interest coverage, Debt/EBITDA and Debt to Capitalization and then provide an assessment of Yellow Hammer's credit quality.
Use for financial statements for Yellow Hammer to answer problems 1-3 L. Assess Yellow Hammer's income statement by calculating the sales growth, EBITDA profitability (EBITDA/Sales) and coverage ratios using EBIT and EBITDA for each year. 2. Assess Yellow Hammer's balance sheet by calculating the leverage ratios using of Debt/Capitalization and Debt/EBITDA. 3. Using the table below and the ratios that you've calculated, insert the EBIT interest coverage, EBITDA interest coverage, Debt/EBITDA and Debt to Capitalization and then provide an assessment of Yellow Hammer's credit quality.

Century 21 Accounting Multicolumn Journal
11th Edition
ISBN:9781337679503
Author:Gilbertson
Publisher:Gilbertson
Chapter17: Financial Statement Analysis
Section17.4: Analyzing Financial Statements Using Financial Ratios
Problem 1WT

Related questions
Question
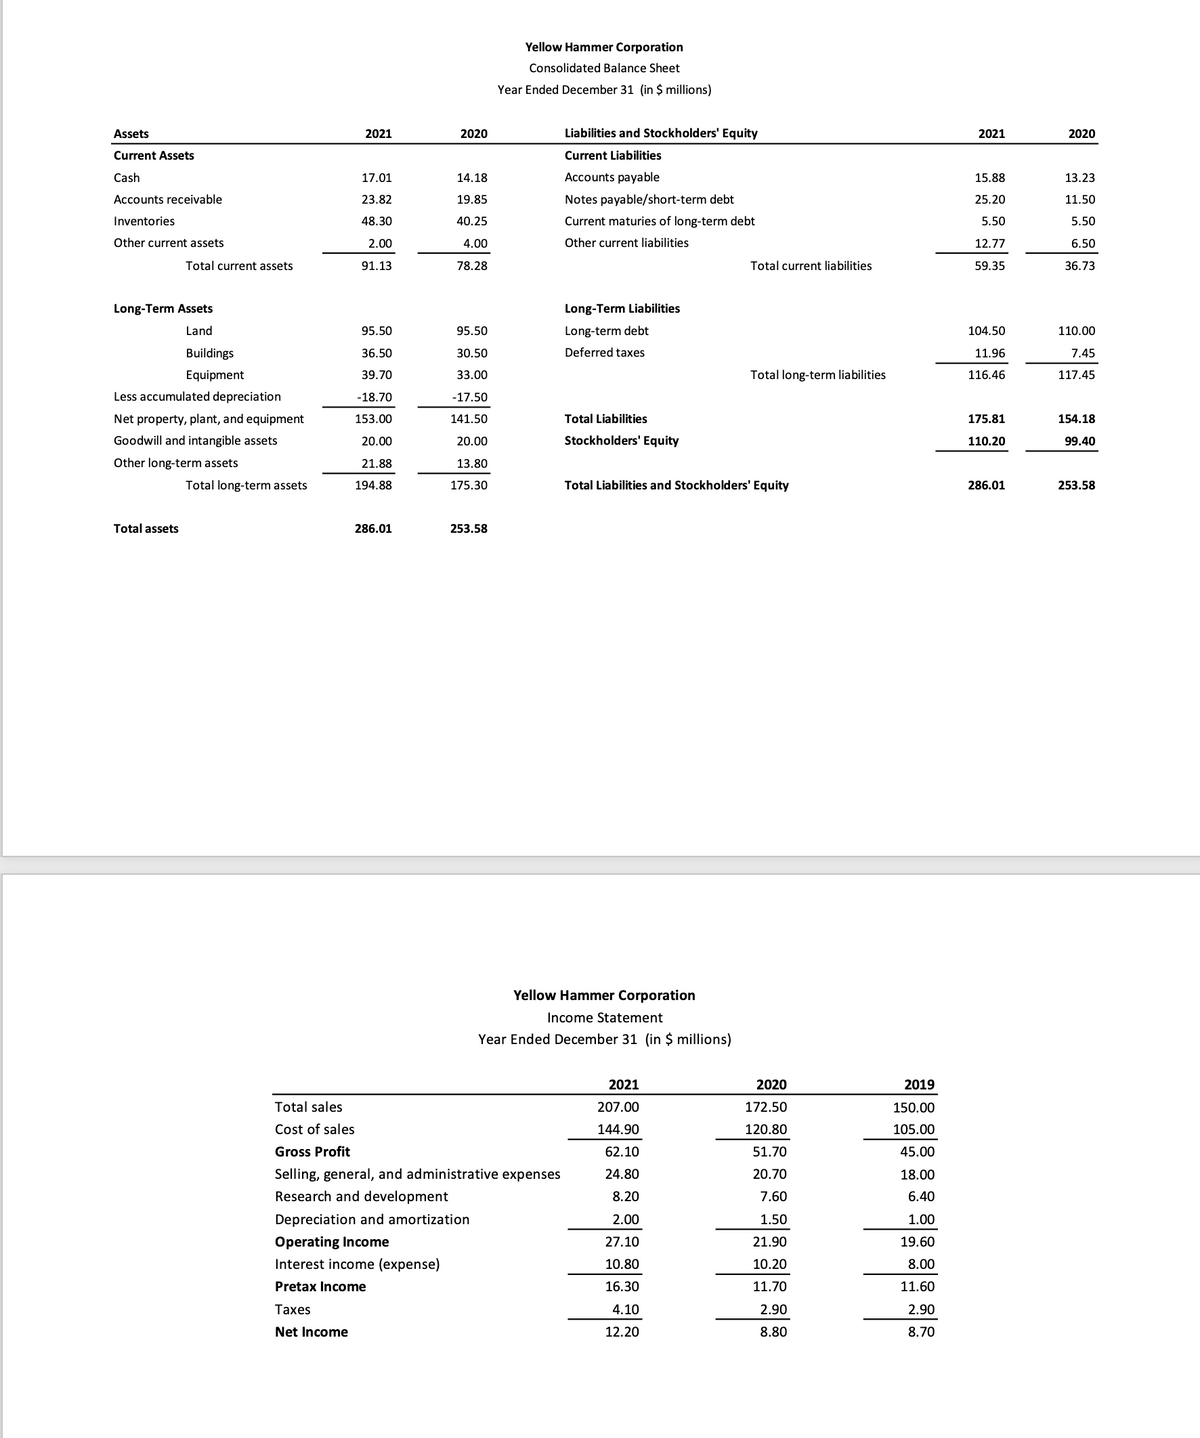
Transcribed Image Text:Assets
Current Assets
Cash
Accounts receivable
Inventories
Other current assets
Total current assets
Long-Term Assets
Land
Total assets
Buildings
Equipment
Less accumulated depreciation
Net property, plant, and equipment
Goodwill and intangible assets
Other long-term assets
Total long-term assets
2021
17.01
23.82
48.30
2.00
91.13
95.50
36.50
39.70
-18.70
153.00
20.00
21.88
194.88
286.01
2020
14.18
19.85
40.25
4.00
78.28
95.50
30.50
33.00
-17.50
141.50
20.00
13.80
175.30
253.58
Yellow Hammer Corporation
Consolidated Balance Sheet
Year Ended December 31 (in $ millions)
Depreciation and amortization
Operating Income
Interest income (expense)
Pretax Income
Taxes
Net Income
Total sales
Cost of sales
Gross Profit
Selling, general, and administrative expenses
Research and development
Liabilities and Stockholders' Equity
Current Liabilities
Accounts payable
Notes payable/short-term debt
Current maturies of long-term debt
Other current liabilities
Long-Term Liabilities
Long-term debt
Deferred taxes
Total Liabilities
Stockholders' Equity
Yellow Hammer Corporation
Income Statement
Year Ended December 31 (in $ millions)
Total current liabilities
Total Liabilities and Stockholders' Equity
2021
207.00
144.90
62.10
24.80
8.20
2.00
27.10
10.80
16.30
4.10
12.20
Total long-term liabilities
2020
172.50
120.80
51.70
20.70
7.60
1.50
21.90
10.20
11.70
2.90
8.80
2019
150.00
105.00
45.00
18.00
6.40
1.00
19.60
8.00
11.60
2.90
8.70
2021
15.88
25.20
5.50
12.77
59.35
104.50
11.96
116.46
175.81
110.20
286.01
2020
13.23
11.50
5.50
6.50
36.73
110.00
7.45
117.45
154.18
99.40
253.58
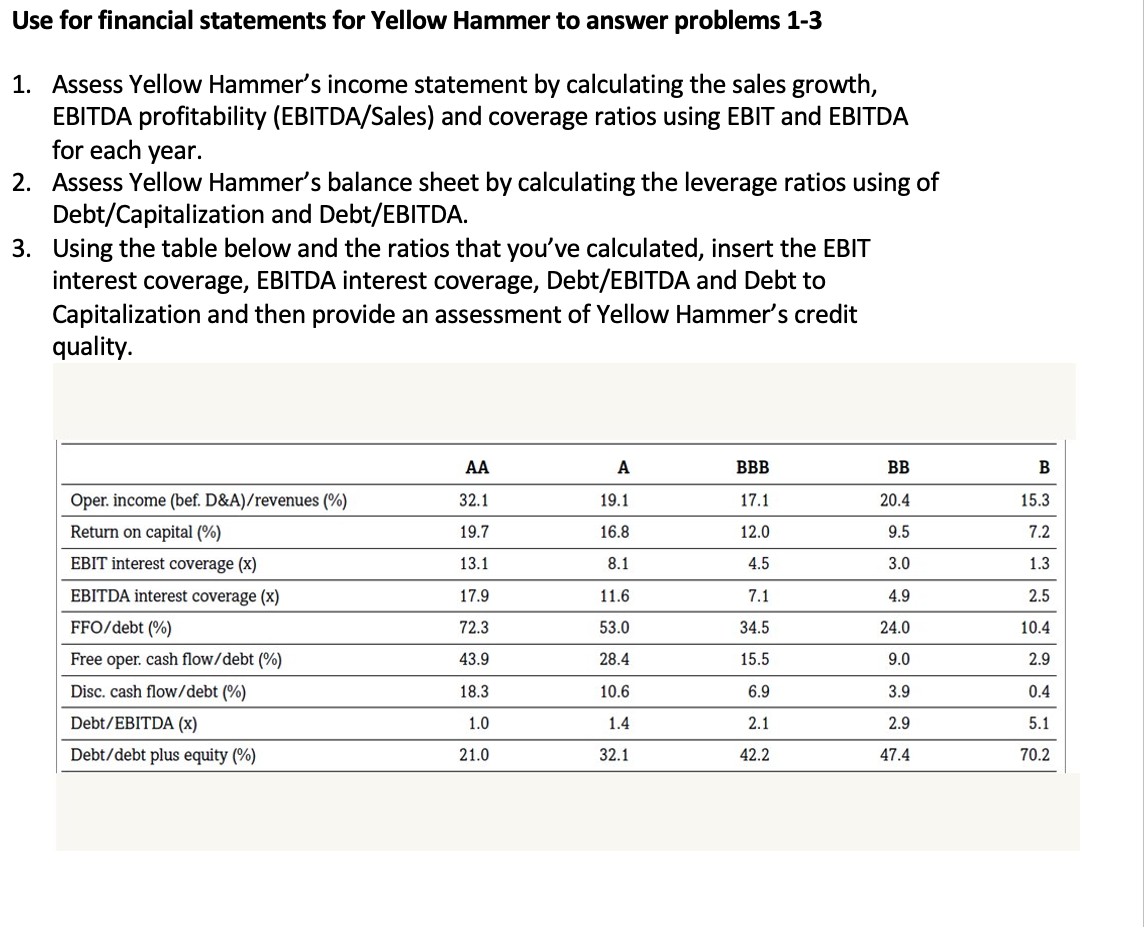
Transcribed Image Text:Use for financial statements for Yellow Hammer to answer problems 1-3
1. Assess Yellow Hammer's income statement by calculating the sales growth,
EBITDA profitability (EBITDA/Sales) and coverage ratios using EBIT and EBITDA
for each year.
2. Assess Yellow Hammer's balance sheet by calculating the leverage ratios using of
Debt/Capitalization and Debt/EBITDA.
3. Using the table below and the ratios that you've calculated, insert the EBIT
interest coverage, EBITDA interest coverage, Debt/EBITDA and Debt to
Capitalization and then provide an assessment of Yellow Hammer's credit
quality.
Oper. income (bef. D&A)/revenues (%)
Return on capital (%)
EBIT interest coverage (x)
EBITDA interest coverage (x)
FFO/debt (%)
Free oper. cash flow/debt (%)
Disc. cash flow/debt (%)
Debt/EBITDA (x)
Debt/debt plus equity (%)
AA
32.1
19.7
13.1
17.9
72.3
43.9
18.3
1.0
21.0
A
19.1
16.8
8.1
11.6
53.0
28.4
10.6
1.4
32.1
BBB
17.1
12.0
4.5
7.1
34.5
15.5
6.9
2.1
42.2
BB
20.4
9.5
3.0
4.9
24.0
9.0
3.9
2.9
47.4
B
15.3
7.2
1.3
2.5
10.4
2.9
0.4
5.1
70.2
Expert Solution
This question has been solved!
Explore an expertly crafted, step-by-step solution for a thorough understanding of key concepts.

This is a popular solution!

Trending now
This is a popular solution!

Step by step
Solved in 5 steps

Knowledge Booster


Learn more about
Need a deep-dive on the concept behind this application? Look no further. Learn more about this topic, accounting and related others by exploring similar questions and additional content below.Recommended textbooks for you
Century 21 Accounting Multicolumn Journal
Accounting
ISBN:
9781337679503
Author:
Gilbertson
Publisher:
Cengage

Managerial Accounting: The Cornerstone of Busines…
Accounting
ISBN:
9781337115773
Author:
Maryanne M. Mowen, Don R. Hansen, Dan L. Heitger
Publisher:
Cengage Learning
Century 21 Accounting Multicolumn Journal
Accounting
ISBN:
9781337679503
Author:
Gilbertson
Publisher:
Cengage
Managerial Accounting: The Cornerstone of Busines…
Accounting
ISBN:
9781337115773
Author:
Maryanne M. Mowen, Don R. Hansen, Dan L. Heitger
Publisher:
Cengage Learning

Financial Accounting: The Impact on Decision Make…
Accounting
ISBN:
9781305654174
Author:
Gary A. Porter, Curtis L. Norton
Publisher:
Cengage Learning

EBK CONTEMPORARY FINANCIAL MANAGEMENT
Finance
ISBN:
9781337514835
Author:
MOYER
Publisher:
CENGAGE LEARNING - CONSIGNMENT