• Use technology to determine the values of t for which s (t) and S (t) have horizontal tangents. (Focus on the first period of the graphs, so t < 25.) • What do you notice about the t values for which the two functions have horizontal tangents?
• Use technology to determine the values of t for which s (t) and S (t) have horizontal tangents. (Focus on the first period of the graphs, so t < 25.) • What do you notice about the t values for which the two functions have horizontal tangents?

Linear Algebra: A Modern Introduction
4th Edition
ISBN:9781285463247
Author:David Poole
Publisher:David Poole
Chapter6: Vector Spaces
Section6.7: Applications
Problem 16EQ

Related questions
Question
Im seeking for help on the bullet point that starts with 'What do you notice about the t values for...', I would also appreciate help on the questions below this bullet point. Thank you!
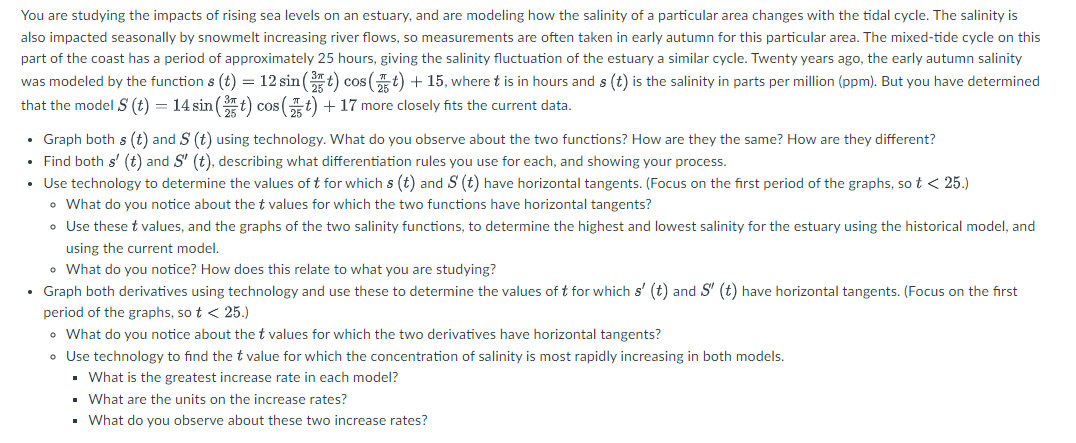
Transcribed Image Text:You are studying the impacts of rising sea levels on an estuary, and are modeling how the salinity of a particular area changes with the tidal cycle. The salinity is
also impacted seasonally by snowmelt increasing river flows, so measurements are often taken in early autumn for this particular area. The mixed-tide cycle on this
part of the coast has a period of approximately 25 hours, giving the salinity fluctuation of the estuary a similar cycle. Twenty years ago, the early autumn salinity
was modeled by the function s (t) = 12 sin(t) cos(t) + 15, where t is in hours and s (t) is the salinity in parts per million (ppm). But you have determined
that the model S (t) = 14 sin (25 t) cos(t) + 17 more closely fits the current data.
• Graph both s (t) and S (t) using technology. What do you observe about the two functions? How are they the same? How are they different?
• Find both s' (t) and S" (t), describing what differentiation rules you use for each, and showing your process.
• Use technology to determine the values of t for which s (t) and S (t) have horizontal tangents. (Focus on the first period of the graphs, so t < 25.)
• What do you notice about the t values for which the two functions have horizontal tangents?
•
Use these t values, and the graphs of the two salinity functions, to determine the highest and lowest salinity for the estuary using the historical model, and
using the current model.
• What do you notice? How does this relate to what you are studying?
• Graph both derivatives using technology and use these to determine the values of t for which s' (t) and S" (t) have horizontal tangents. (Focus on the first
period of the graphs, so t < 25.)
• What do you notice about the t values for which the two derivatives have horizontal tangents?
• Use technology to find the t value for which the concentration of salinity is most rapidly increasing in both models.
▪ What is the greatest increase rate in each model?
▪ What are the units on the increase rates?
▪ What do you observe about these two increase rates?
Expert Solution
This question has been solved!
Explore an expertly crafted, step-by-step solution for a thorough understanding of key concepts.

This is a popular solution!

Trending now
This is a popular solution!

Step by step
Solved in 5 steps with 5 images

Recommended textbooks for you
Linear Algebra: A Modern Introduction
Algebra
ISBN:
9781285463247
Author:
David Poole
Publisher:
Cengage Learning


Algebra & Trigonometry with Analytic Geometry
Algebra
ISBN:
9781133382119
Author:
Swokowski
Publisher:
Cengage
Linear Algebra: A Modern Introduction
Algebra
ISBN:
9781285463247
Author:
David Poole
Publisher:
Cengage Learning
Algebra & Trigonometry with Analytic Geometry
Algebra
ISBN:
9781133382119
Author:
Swokowski
Publisher:
Cengage


College Algebra (MindTap Course List)
Algebra
ISBN:
9781305652231
Author:
R. David Gustafson, Jeff Hughes
Publisher:
Cengage Learning

Glencoe Algebra 1, Student Edition, 9780079039897…
Algebra
ISBN:
9780079039897
Author:
Carter
Publisher:
McGraw Hill